The New Cross area includes several busy roads, and is characterised by the Goldsmiths, University of London campus, as well as by mixed housing and shops. While monitoring in this area indicates that traffic is a clear source of PM2.5 emissions, pollutant levels recorded here were somewhat moderate in comparison to other major traffic intersections.
This data story details below how citizen data, weather data and local observations reveal these specific pollution patterns. Drawing on workshops with local residents, the data story also suggests how best to address the problem, from planning for better transport to preserving and enhancing green spaces that prevent and mitigate high pollution levels.
I. The Location
The New Cross monitoring location, which includes Dustboxes 118, 142 and 148, is characterised by Goldsmiths, University of London campus, as well as several busy roads that cross through southeast London. Fordham Park is to the north of the monitoring location, and the Brockley Nature Reserve is to the south along the trainline that connects New Cross Gate station with central London. There are several schools in the area, and land use is primarily residential, with localised concentrations of shops, cultural centres and restaurants.
In total, 30 monitors were distributed to participants. The monitoring period ran for over 9 months, until September 2017. During peak monitoring activity, there were 21 active Dustboxes.
The New Cross area, along with Deptford, is also a site of ongoing development and redevelopment, with construction sites located at the periphery of this immediate area. Goldsmiths campus is not currently the site of intensive construction or development, although there are pockets of construction activity on site, including the renovation of the Laurie Grove Baths to construct a new Art Gallery, and student housing on New Cross Road. On the whole, the primary emission-causing activities in the New Cross location consist of transport-related source.
Local sources of particulate pollution
This data story draws together documentation from three monitoring sites on the Goldsmiths campus. Dustboxes in these sites monitor for PM2.5, and are located in roadside, urban background and elevated settings. Dustbox 142 is located on the steps of a Georgian terraced house on Lewisham Way, which is a busy artery road, the A20. The monitor is sheltered in an entranceway and is raised approximately 2 metres off the ground, and faces northeast. Dustbox 148 is located at ground level the very back of the campus, and faces southeast. Dustbox 118 is situated in a DIY Stevenson screen shelter on the top floor of a 39-metre-tall 14-storey building, and faces northeast.
Possible local emissions sources in the area relating to transportation, heating and construction are shown in the above map. The New Cross monitoring sites are in the vicinity of a major one-way traffic thoroughfare where the A20 and A2 roads intersect. Dustbox 142 is approximately 3 metres from Lewisham Way (A20), which is a likely source of vehicle emissions, including from diesel and brake wear and tear.
The Dustbox 142 monitoring location is approximately 60 metres away from a major traffic junction between Lewisham Way (A20) and Parkfield Road (A2), the southern route of this one-way system. Dustbox 118 is situated approximately 60 metres from a second major junction on the northern part of this one-way system, where Lewisham Way (A20) and New Cross Road (A2) merge.
Two railway lines serving predominantly electric trains lie to the east and west of the Goldsmiths campus, which are approximately 95 metres from Dustbox 148. Approximately 75 metres north of Dustbox 148 is the Professor Stuart Hall Building, which uses a biomass boiler for heating, and is a possible emissions source. There is one small construction site on New Cross Road (A2), which is another possible local emissions source.
London-wide, regional and global sources of particulate pollution
Particulate matter sources in London can be attributed to a broad range of emissions. Within London, PM2.5 from transport (particularly diesel), industry, construction, cooking and heating all contribute significantly to London-wide levels. A significant amount of PM2.5 emissions also comes from heavy industry and agriculture outside the UK, particularly France, Belgium, the Netherlands, Luxembourg, Germany and Poland. These emissions are thought to account for an urban background of approximately 10 µg/m3. The importance of these transboundary effects of PM2.5 emissions from outside of the UK on the total London PM2.5 can vary between 40% to 80% daily depending on weather conditions. When long-range pollution episodes do occur in London, they are generally carried on easterly winds. There are a number of global emissions, events and practices that contribute particulate matter to the total London PM2.5, including fuel production, industrial and domestic combustion, transportation, waste disposal, and agriculture, although these are harder to quantify.
Observations
We have observed significant idling at the two junctions where the A2 and A20 roads meet, where vehicles are stopped for traffic signalling changes and are frequently waiting due to congested roads. At peak times, the roads are extremely congested. Heavy goods vehicles make significant use of this route. Monitoring participants have observed that when cycling and walking through this area, they can smell and feel air pollution. Parents have reported concerns that the Goldsmiths nursery facilities are located directly on Lewisham Way (A20), which has idling traffic approximately 3 metres from the nursery facility. Windows in the nursery must be kept closed at all times due to air quality concerns.
II. Is there evidence of a problem?
The Dustbox device used to monitor PM2.5 particles is an “indicative” monitor. This means that measurements can give an indication of pollutant concentrations, but cannot be directly compared with national and international guidelines and standards in an “official” or regulatory sense. Despite this, indicative monitors are a well-established method within atmospheric science for carrying out initial surveys of an area to establish whether a potential problem merits further investigation. Indicative monitors are also becoming increasingly available for citizen-based air-quality monitoring, similar to this study. Where possible, the Dustboxes were co-located at the start and the end of the study to account for differences in the sensors and drift during the monitoring period.
The indicative Dustbox monitors used in this study demonstrate high levels of PM2.5. Since monitoring began at this site in December 2016, particulate levels were elevated above the World Health Organisation (WHO) guideline of 25 µg/m3 for 24-hour daily mean concentration of PM2.5 on a number of occasions.
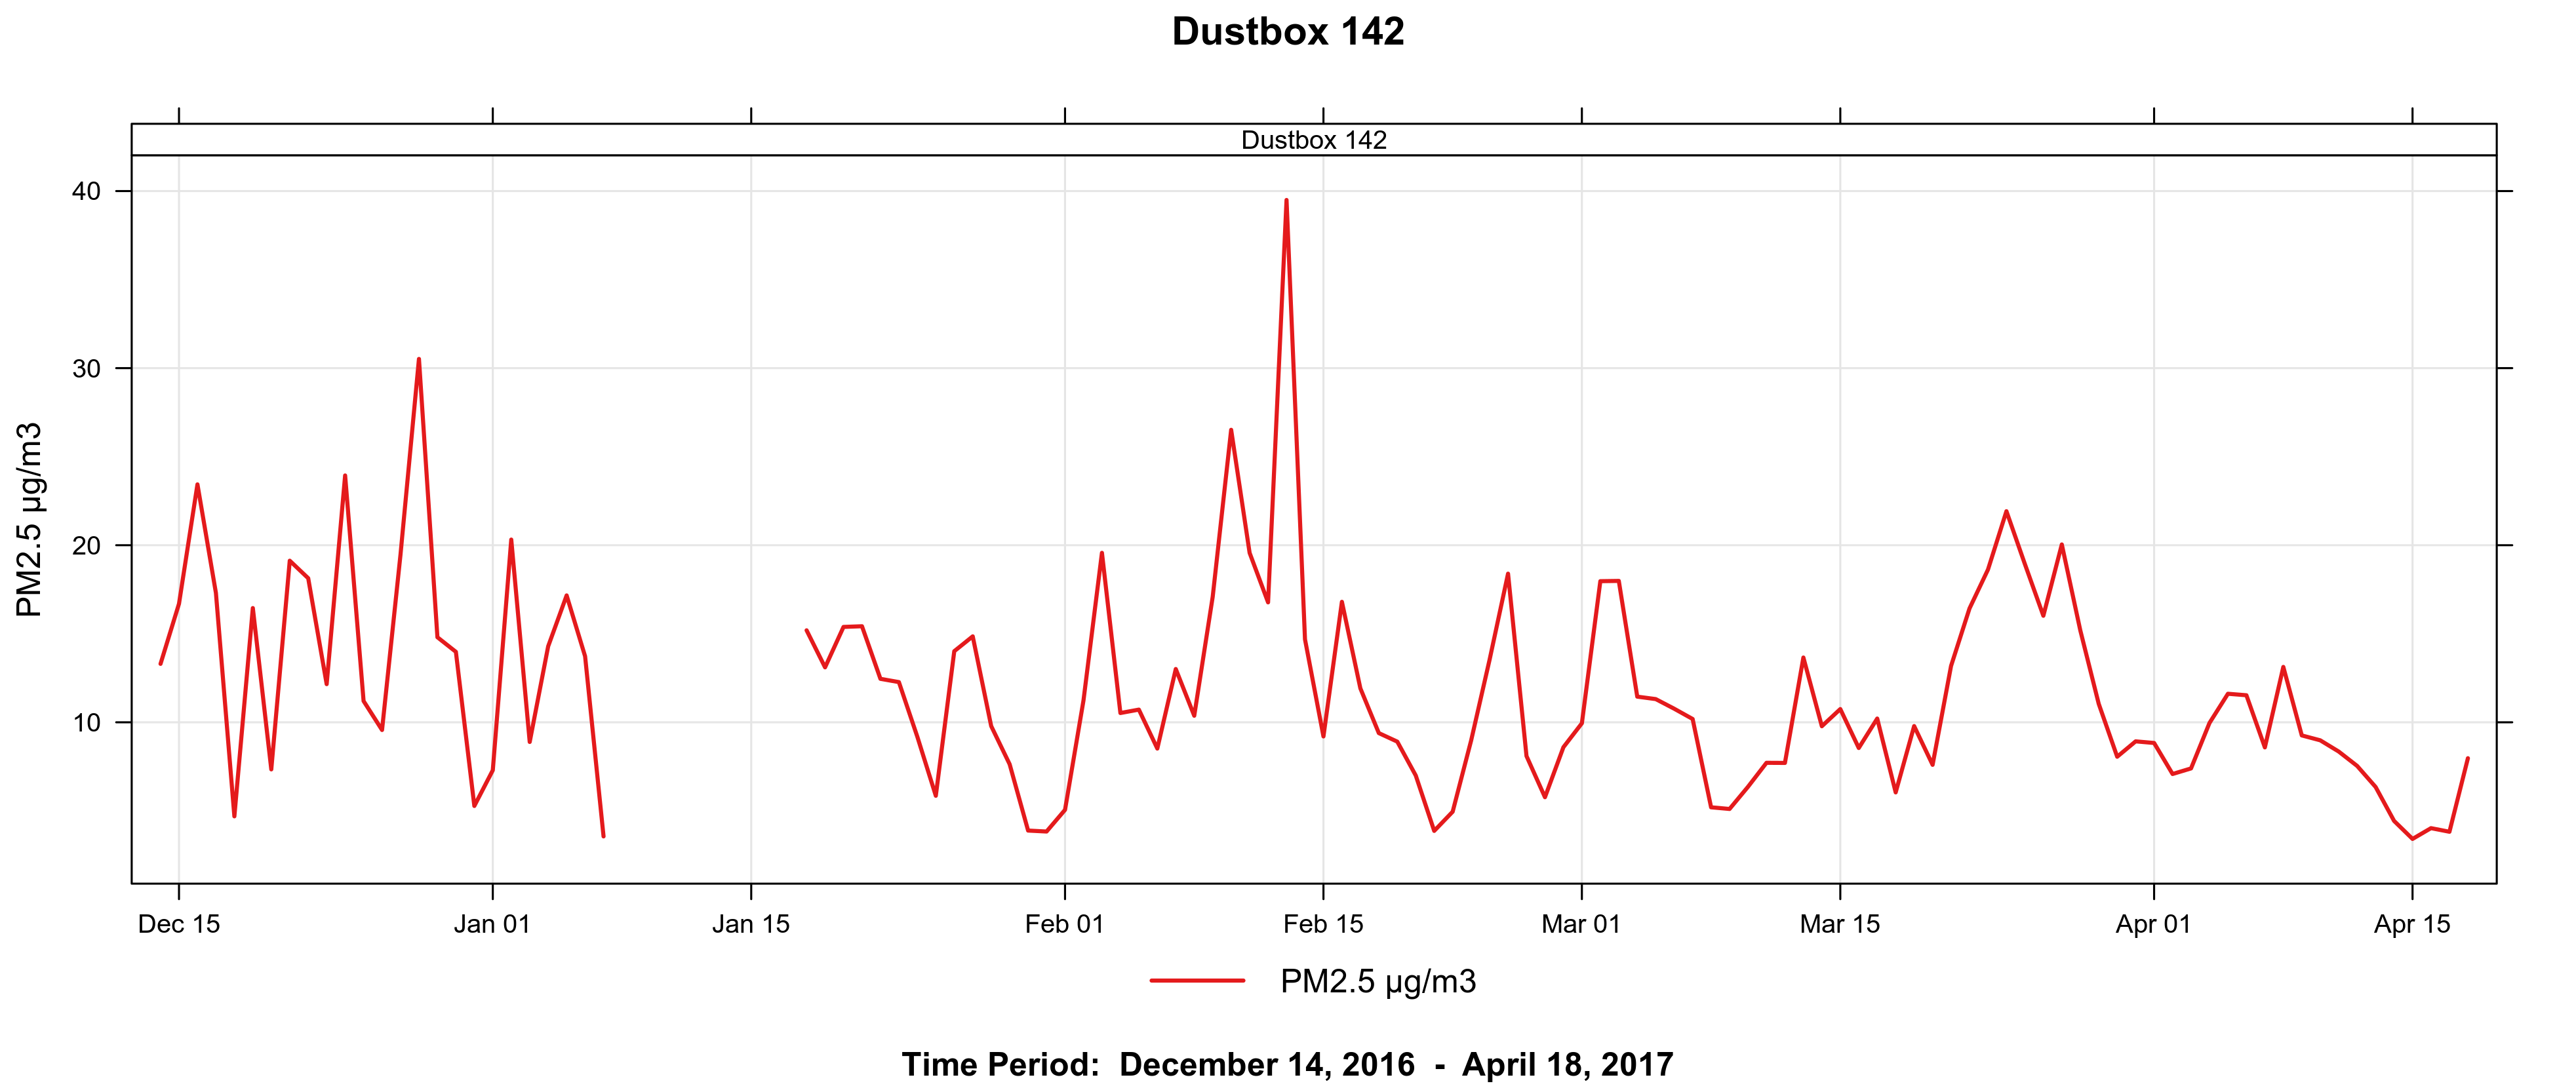
Figure 1 demonstrates that particulate levels in December 2016 and February 2017 were significantly elevated. These exceedances of the WHO 24-hour mean guideline also correspond with a nearby New Cross monitoring station in the London Air Quality Network (LAQN), which documented these episodes of moderate to high particulate pollution across London. However, there are also high levels of particulates in February, March and April, which suggest there may be local sources of particulate pollution that can be identified beyond London-wide pollution events.
It is important to determine whether these exceedances were caused by “local” sources of pollution close to the sensor (i.e., within 300 meters), or by regional sources affecting the whole area. Local sources often augment regional sources, which can be revealed as a spike on top of a hump. In a general sense, this regional-local pattern occurs because pollution mixes in the atmosphere as it travels away from a source, smoothing the speed of changes in concentrations.
There are many possible sources of pollution in the area, and we have to look at the measurements more closely to see if we can deduce which activities are causing these spikes. Knowing the source of pollution is important as some activities produce more toxic particulate matter than others, and actions to mitigate sources should be targeted to the cause of the problem.
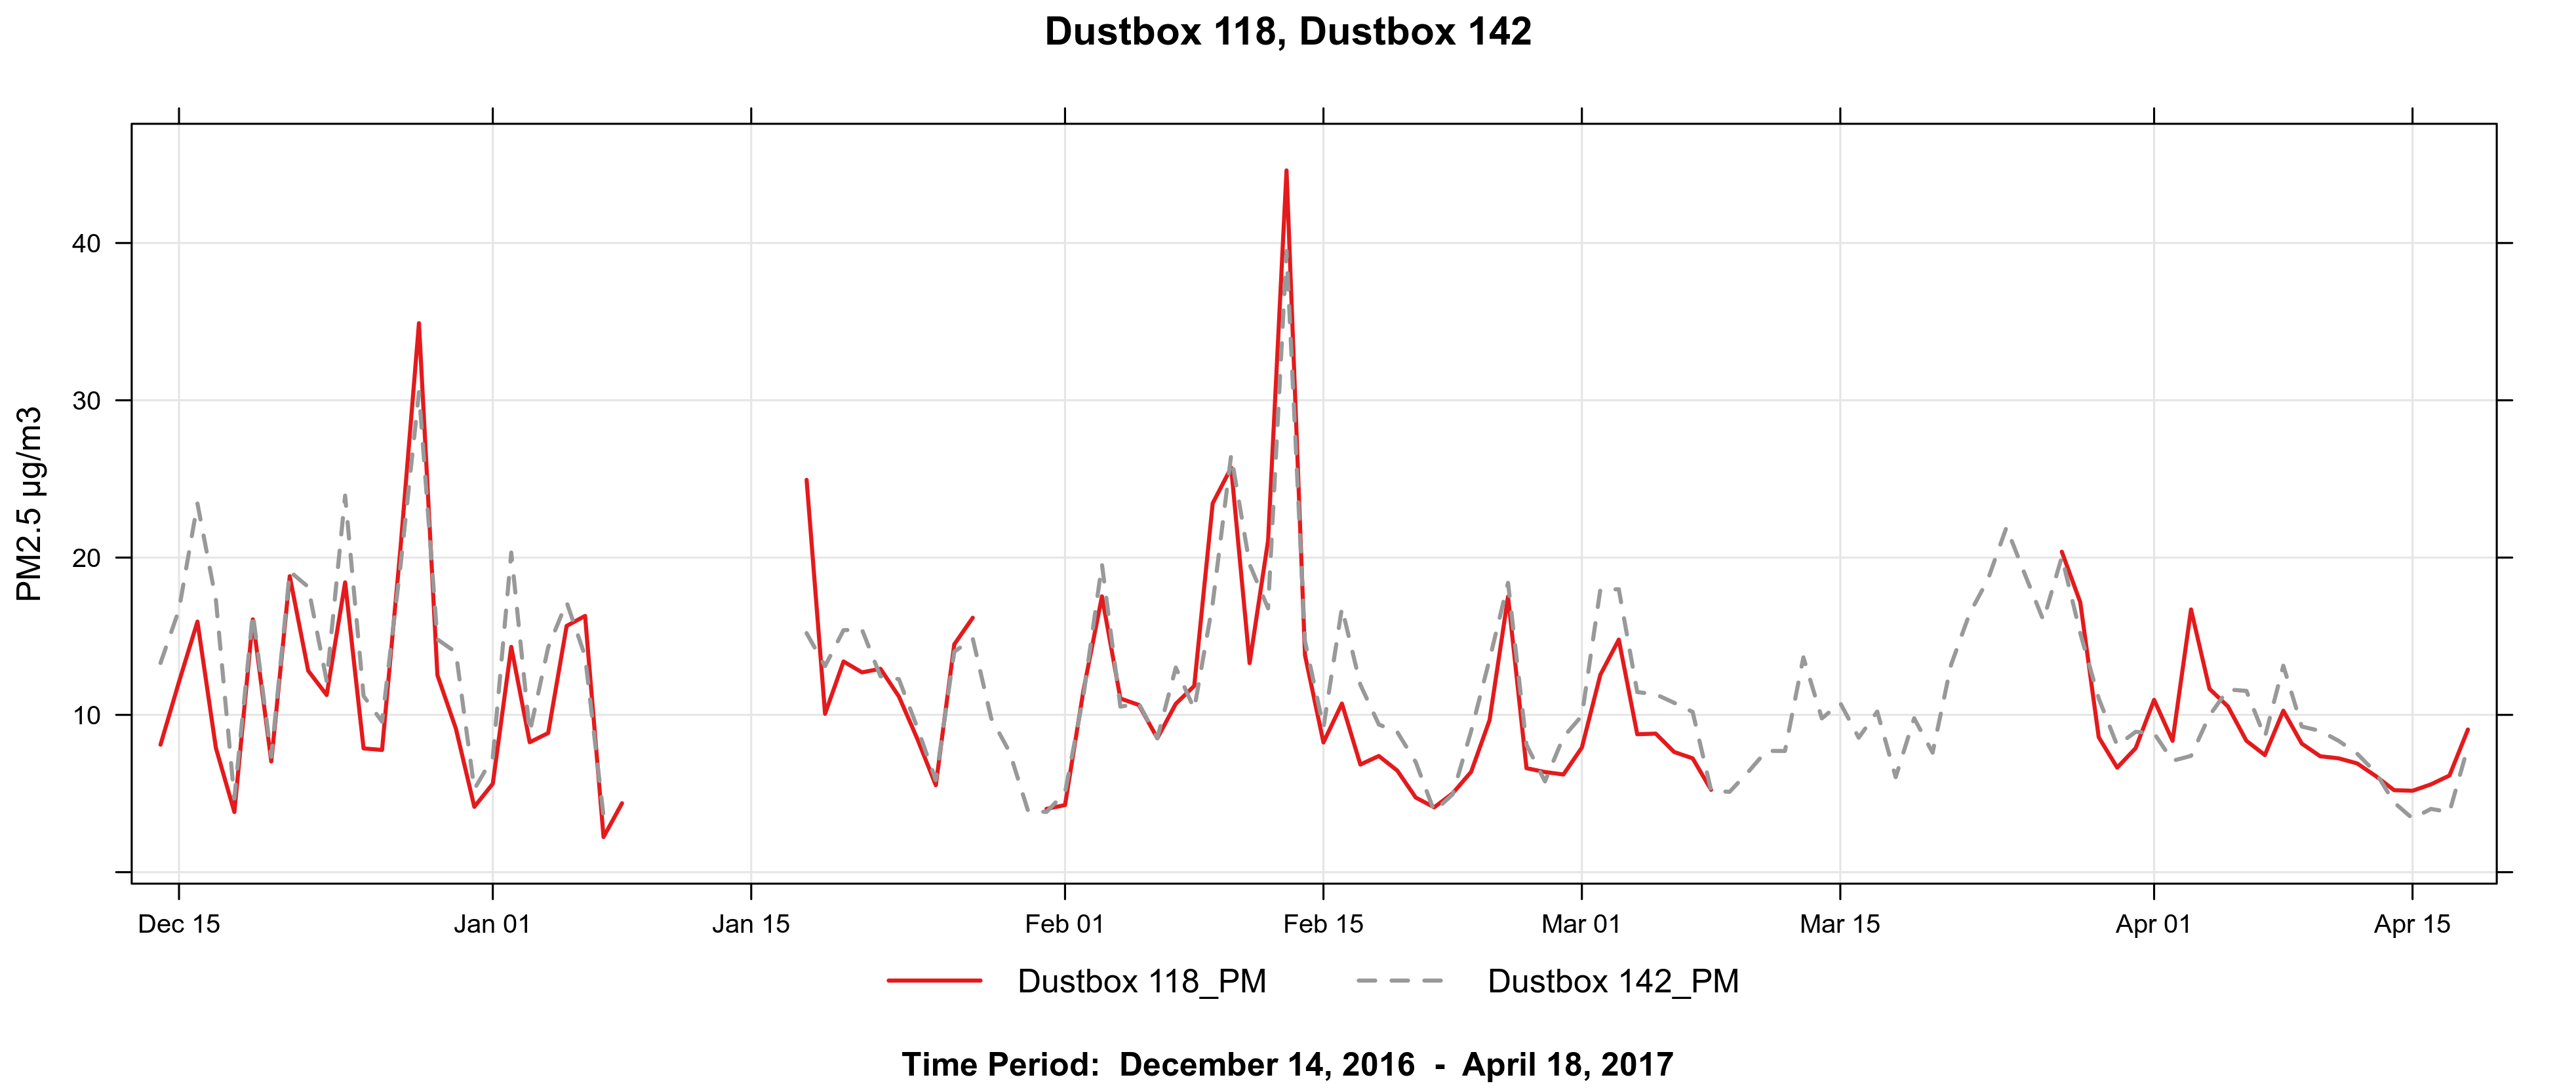

When compared to Dustbox 118, the 24-hour mean PM2.5 concentrations for Dustbox 142 are very similar, as shown in Figure 2. However, if we look at hourly PM2.5 concentrations as shown in Figure 3 we can see that in some cases there are spikes of particulate levels in the Dustbox 142 data, in comparison to the broader levels or “humps” of Dustbox 118 data. This spikey pattern for the roadside Dustbox 142 data suggests a local source of pollution, which is not evident at the elevated Dustbox 118 location. The Dustbox 142 readings also indicate different local emission sources when compared to the nearest LAQN station, New Cross. This LAQN station is located on New Cross Road (A2), opposite the New Cross Gate train station.

As shown in Figure 4, the LAQN New Cross monitor shows more elevated readings in comparison to Dustbox 142, which indicates different local emission sources.

Because Dustbox 148 is located at the back of the Goldsmiths campus and is sited away from roadside emissions sources, we expected levels of particulate matter to be lower at this location in comparison to the roadside monitor, Dustbox 142. However, Dustbox 148 regularly posted elevated levels of PM2.5, as shown in Figure 5.
Highlighting patterns of local particulate pollution
Figure 6 below shows Dustbox 142 readings from the end of January 2017 to the middle of February 2017, including an episode of moderate PM2.5 recorded at the LAQN New Cross monitoring station from 10 to 13 February 2017. Outside of this episode of elevated pollution, we can see a possible episode of local pollution at the Dustbox 142 site from 2 to 4 February 2017, where the line graph indicates a spike, or elevated levels, at this location, which could indicate a local source of emissions.

Similarly, Figure 7 below compares readings from Dustbox 118 with the LAQN New Cross monitoring station from November 2016 to December 2016. Elevated levels are evident at the LAQN location from 29 November 2016 to 6 December 2016. However, just before this episode, we can see elevated levels of PM2.5 at the Dustbox 118 monitoring site between 21 to 22 November and 24 to 26 November. These readings could indicate local pollution episodes.

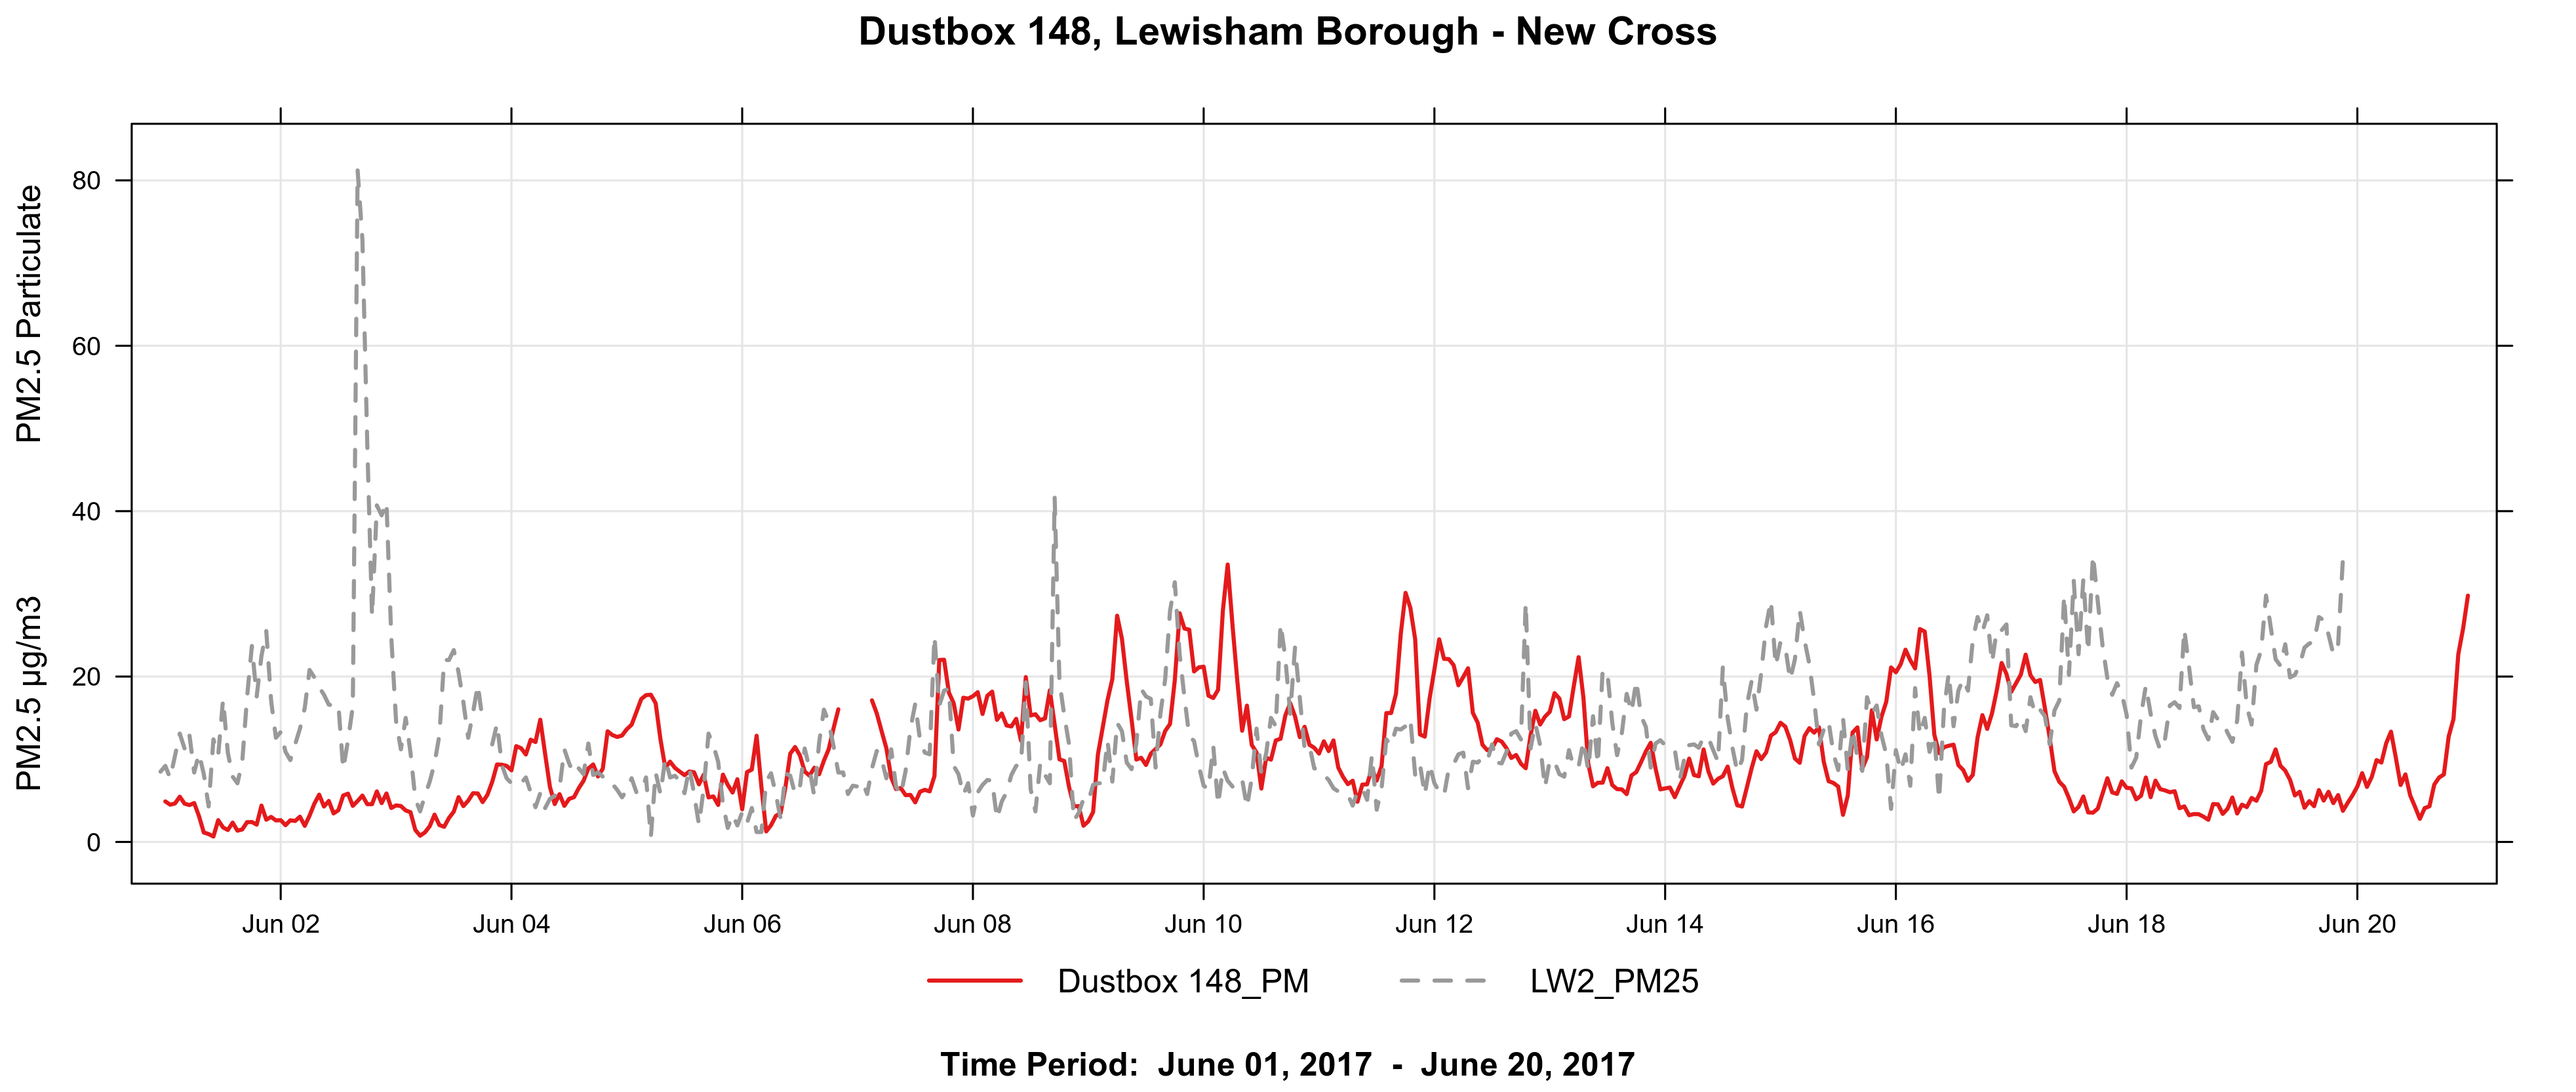
Finally, as shown in Figure 8, we can discern peaks in Dustbox 148 data at Goldsmiths that are distinct from the LAQN New Cross monitoring station, for example on 5 and 7 June 2017, as well as 11 to 12 June 2017 and 16 June 2017.
III. Characterizing the problem
When is the source most evident?
Using time plots, it is possible to analyse time of day and day of week, as well as month, when pollution levels are elevated. Time plots aggregate PM2.5 concentrations according to time, so that key patterns such as rush hours and traffic, as well as possible construction or industry sources, along with regional pollution events due to seasonal variation, are evident.
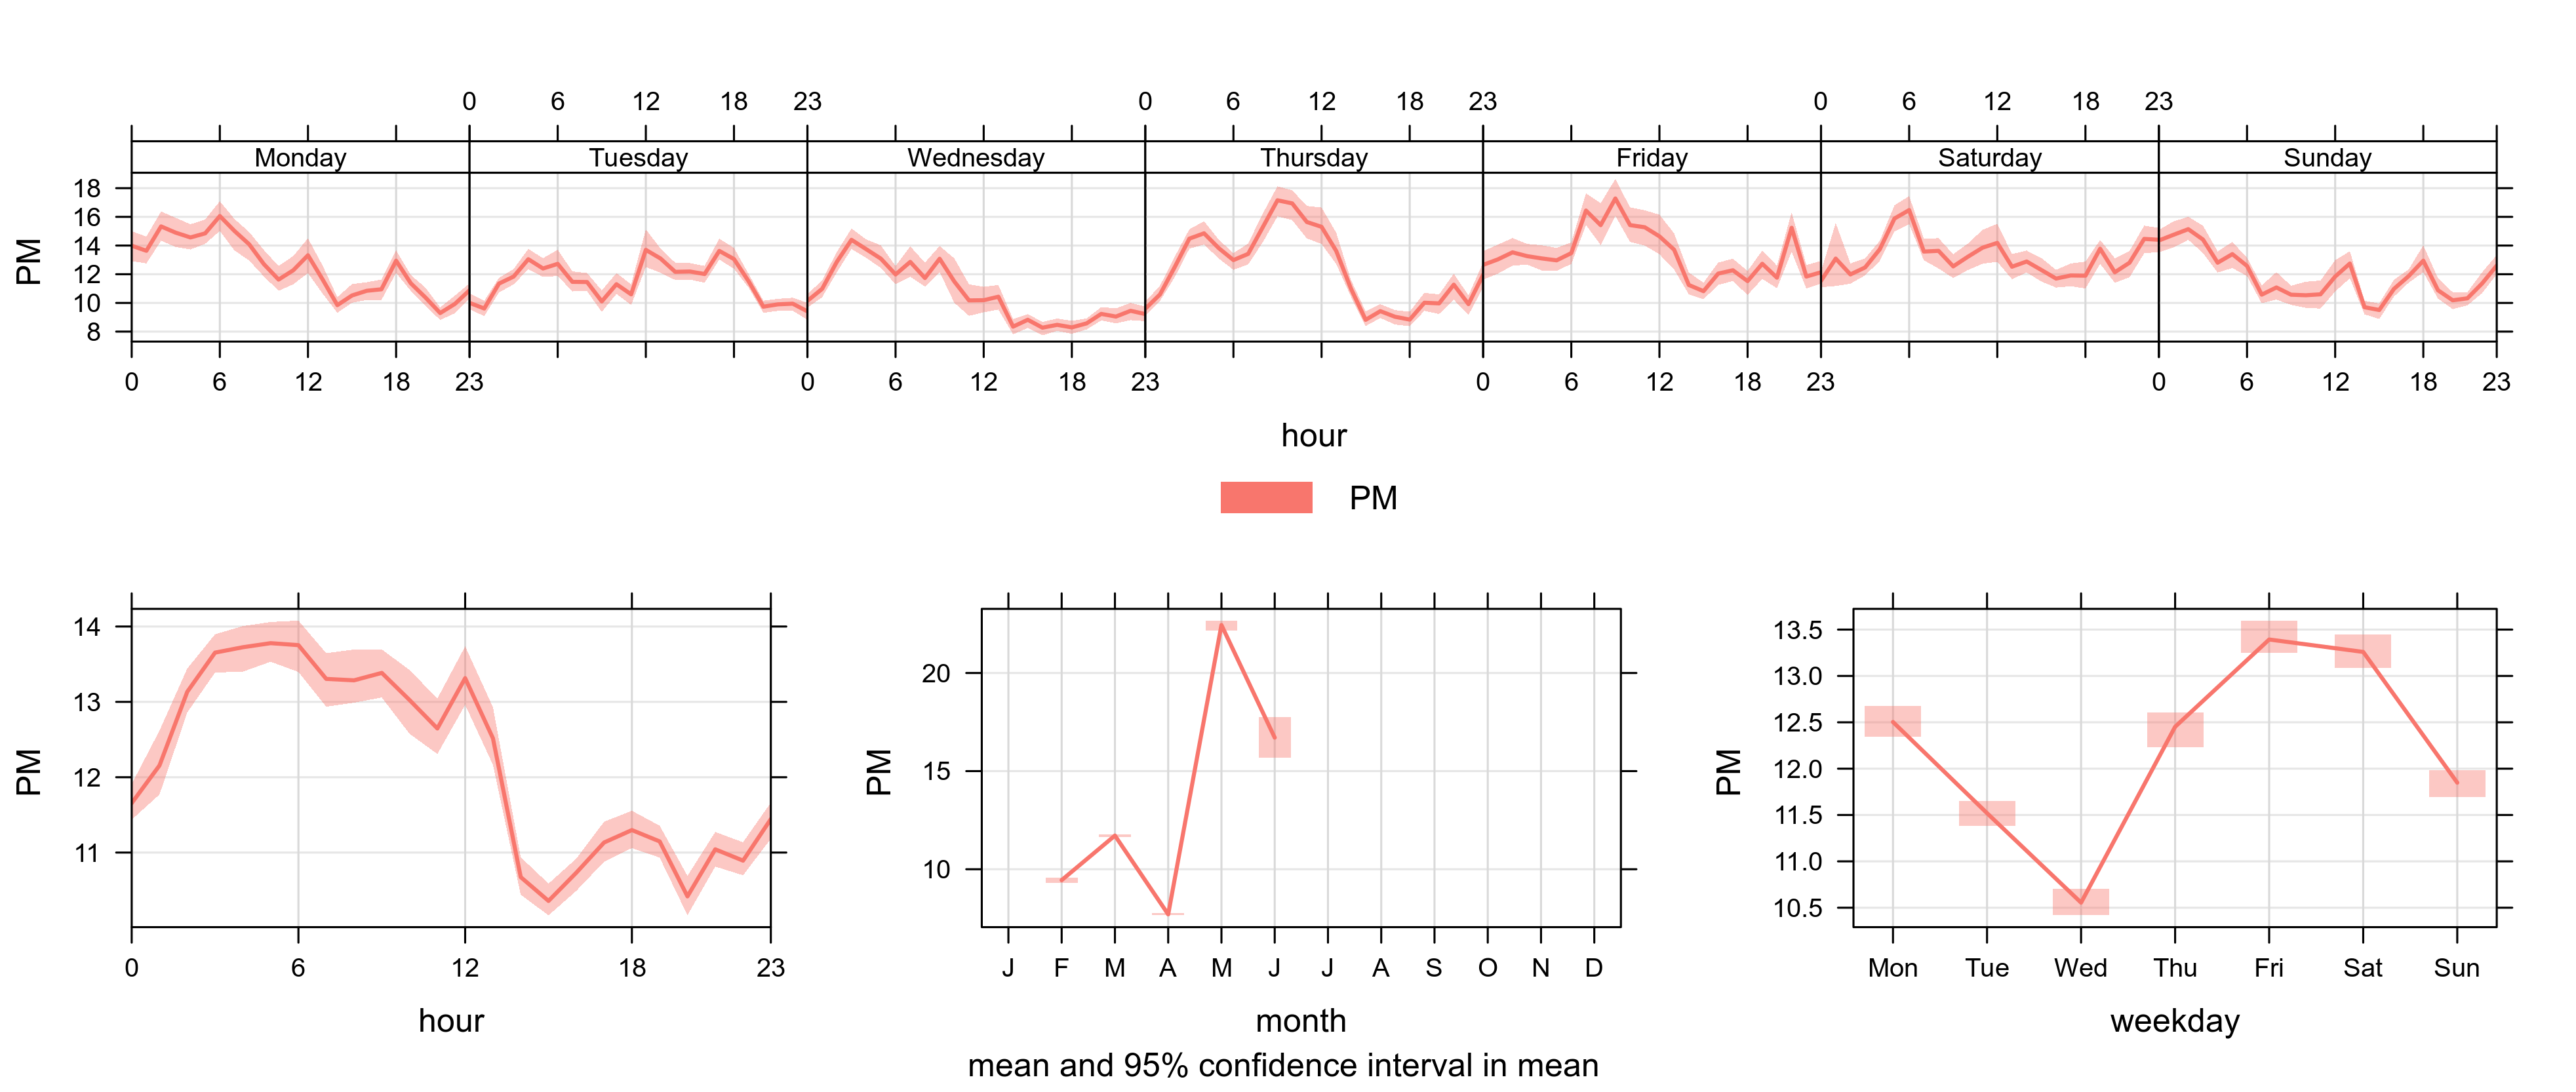
Dustbox 142 registers the highest readings during weekday daytimes, from the early hours of the morning through to approximately 1 pm. In roadside monitoring sites such as this, where vehicles are expected to contribute a significant portion of local emissions, we would expect to see higher readings during the day, and lower readings at night and on weekends. This is partly reflected in the time plot for 142, which shows morning peaks that may be attributable to commuter traffic. However, during the monitoring period levels are lower on Wednesdays than Sundays, and levels are somewhat elevated during Saturday nights. However, overall levels at this location are still below the WHO guideline.

The pattern for Dustbox 118, which is located on the 12th floor roof terrace of Warmington Tower, is reversed. With Dustbox 118, levels of particulate matter rise in the evenings and peak overnight. In a general sense, it should be noted that the weather plays a significant role in particulate levels. For example, dust tends to be dispersed more slowly during the hours of darkness, as vertical and horizontal wind speeds are generally lower. This phenomenon may skew charts somewhat.
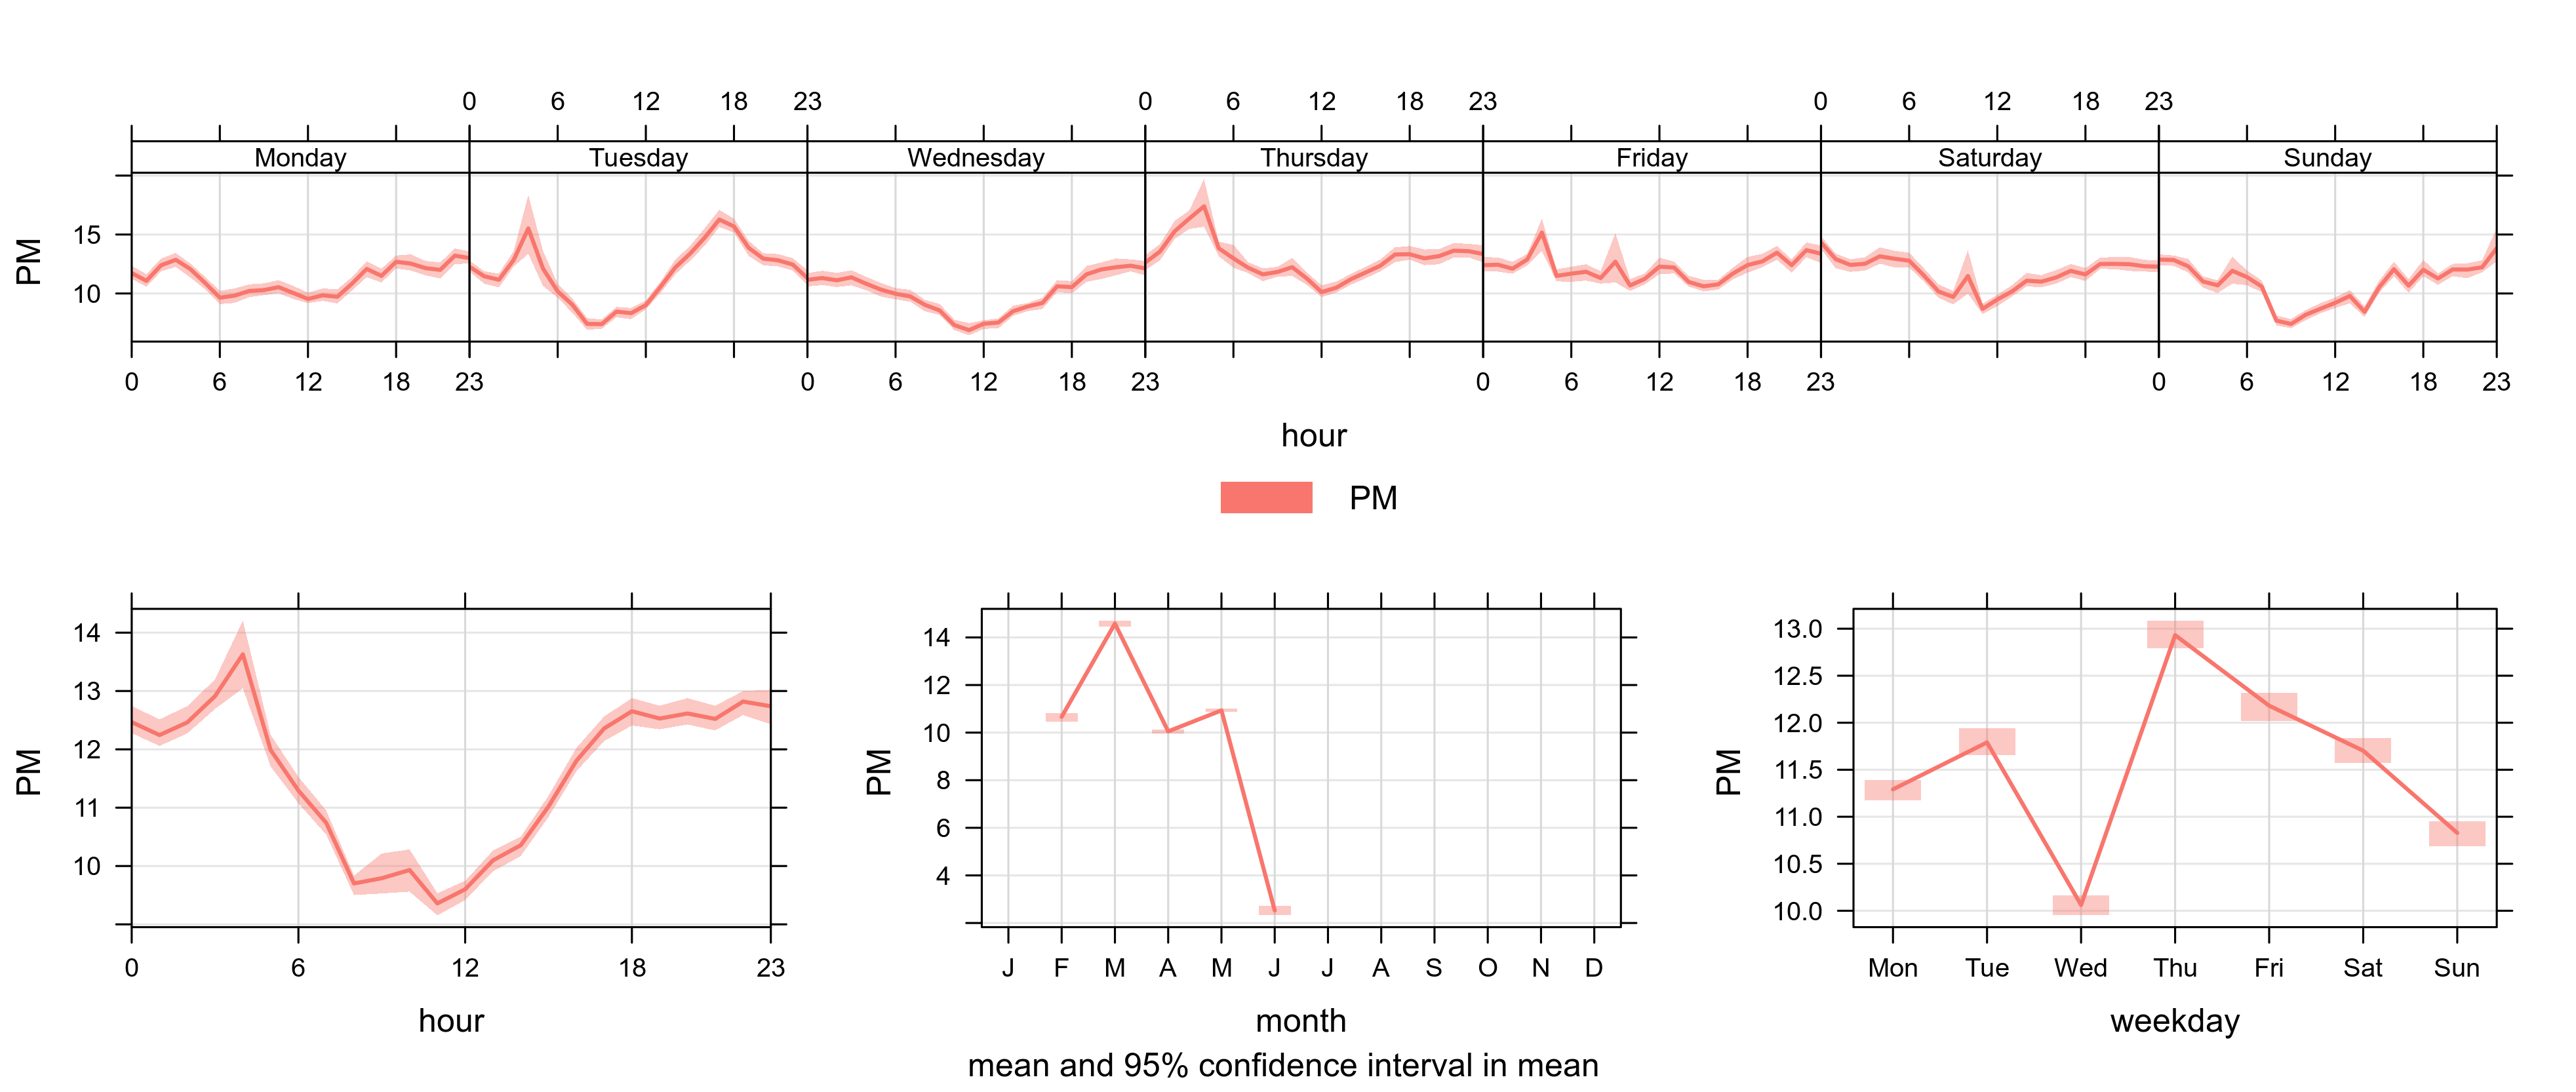
Figure 11 indicates that Dustbox 148 records high morning and evening peaks on some days, yet also features lower daytime levels overall. The raised levels overnight are similar to the patterns for Dustbox 118.
Which direction is PM2.5 coming from?
In these polar plots, colour contours reflect pollutant concentrations in relation to wind direction and wind speed. Calm conditions (zero wind) are shown in the centre, increasing to 20 metres per second (ms-1) at the outer ring. The highest mean concentrations are shown in red, the lowest are in blue.
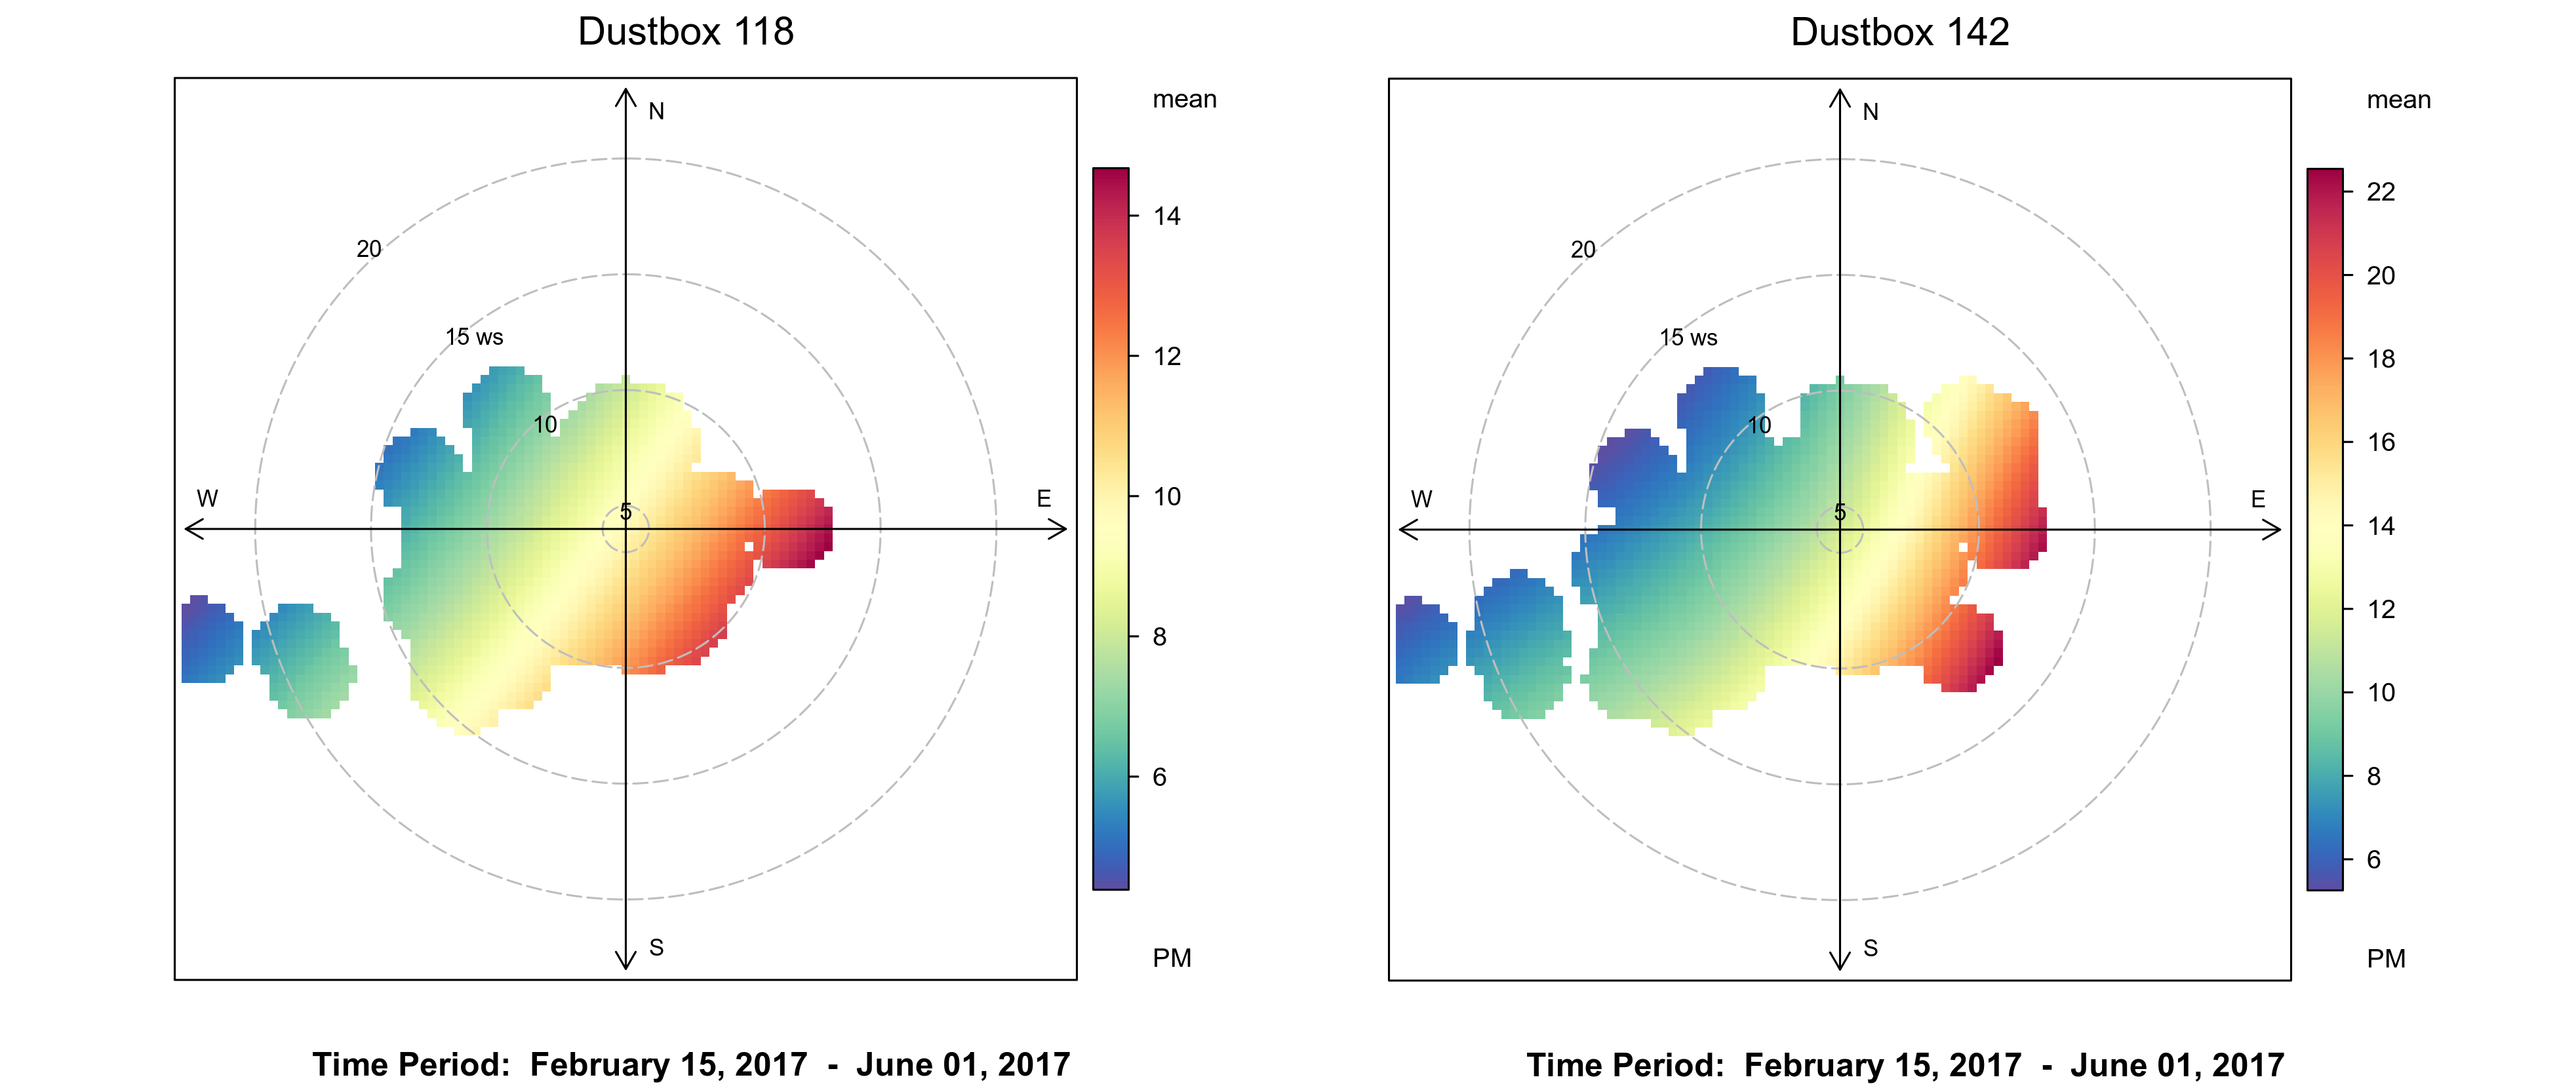
As shown in the polar plot for Dustbox 118, the highest PM2.5 levels are registered when winds blow from the east at a moderate rate of between 10 to 15 ms-1. However, high levels are also recorded at lower wind speeds of between 5 to 10 ms-1 across the east and southeast (approximately 80O to 180O). At these wind speeds, intermediate levels of pollution are registered to the southwest and northeast, suggesting a range of local emissions sources. Clean air travels to the monitoring site from the west and northwest.
Dustbox 142 follows a broadly similar pattern, registering the highest PM2.5 levels when winds are travelling east and southeast at a moderate level of between 10 to 15 ms-1. At lower wind speeds of between 5 to 10 ms-1, Dustbox 142 registers moderate PM2.5 levels from the northeast right through to the southwest (approximately 35O to 230O). Again, cleaner air is carried on west and northwesterly winds.
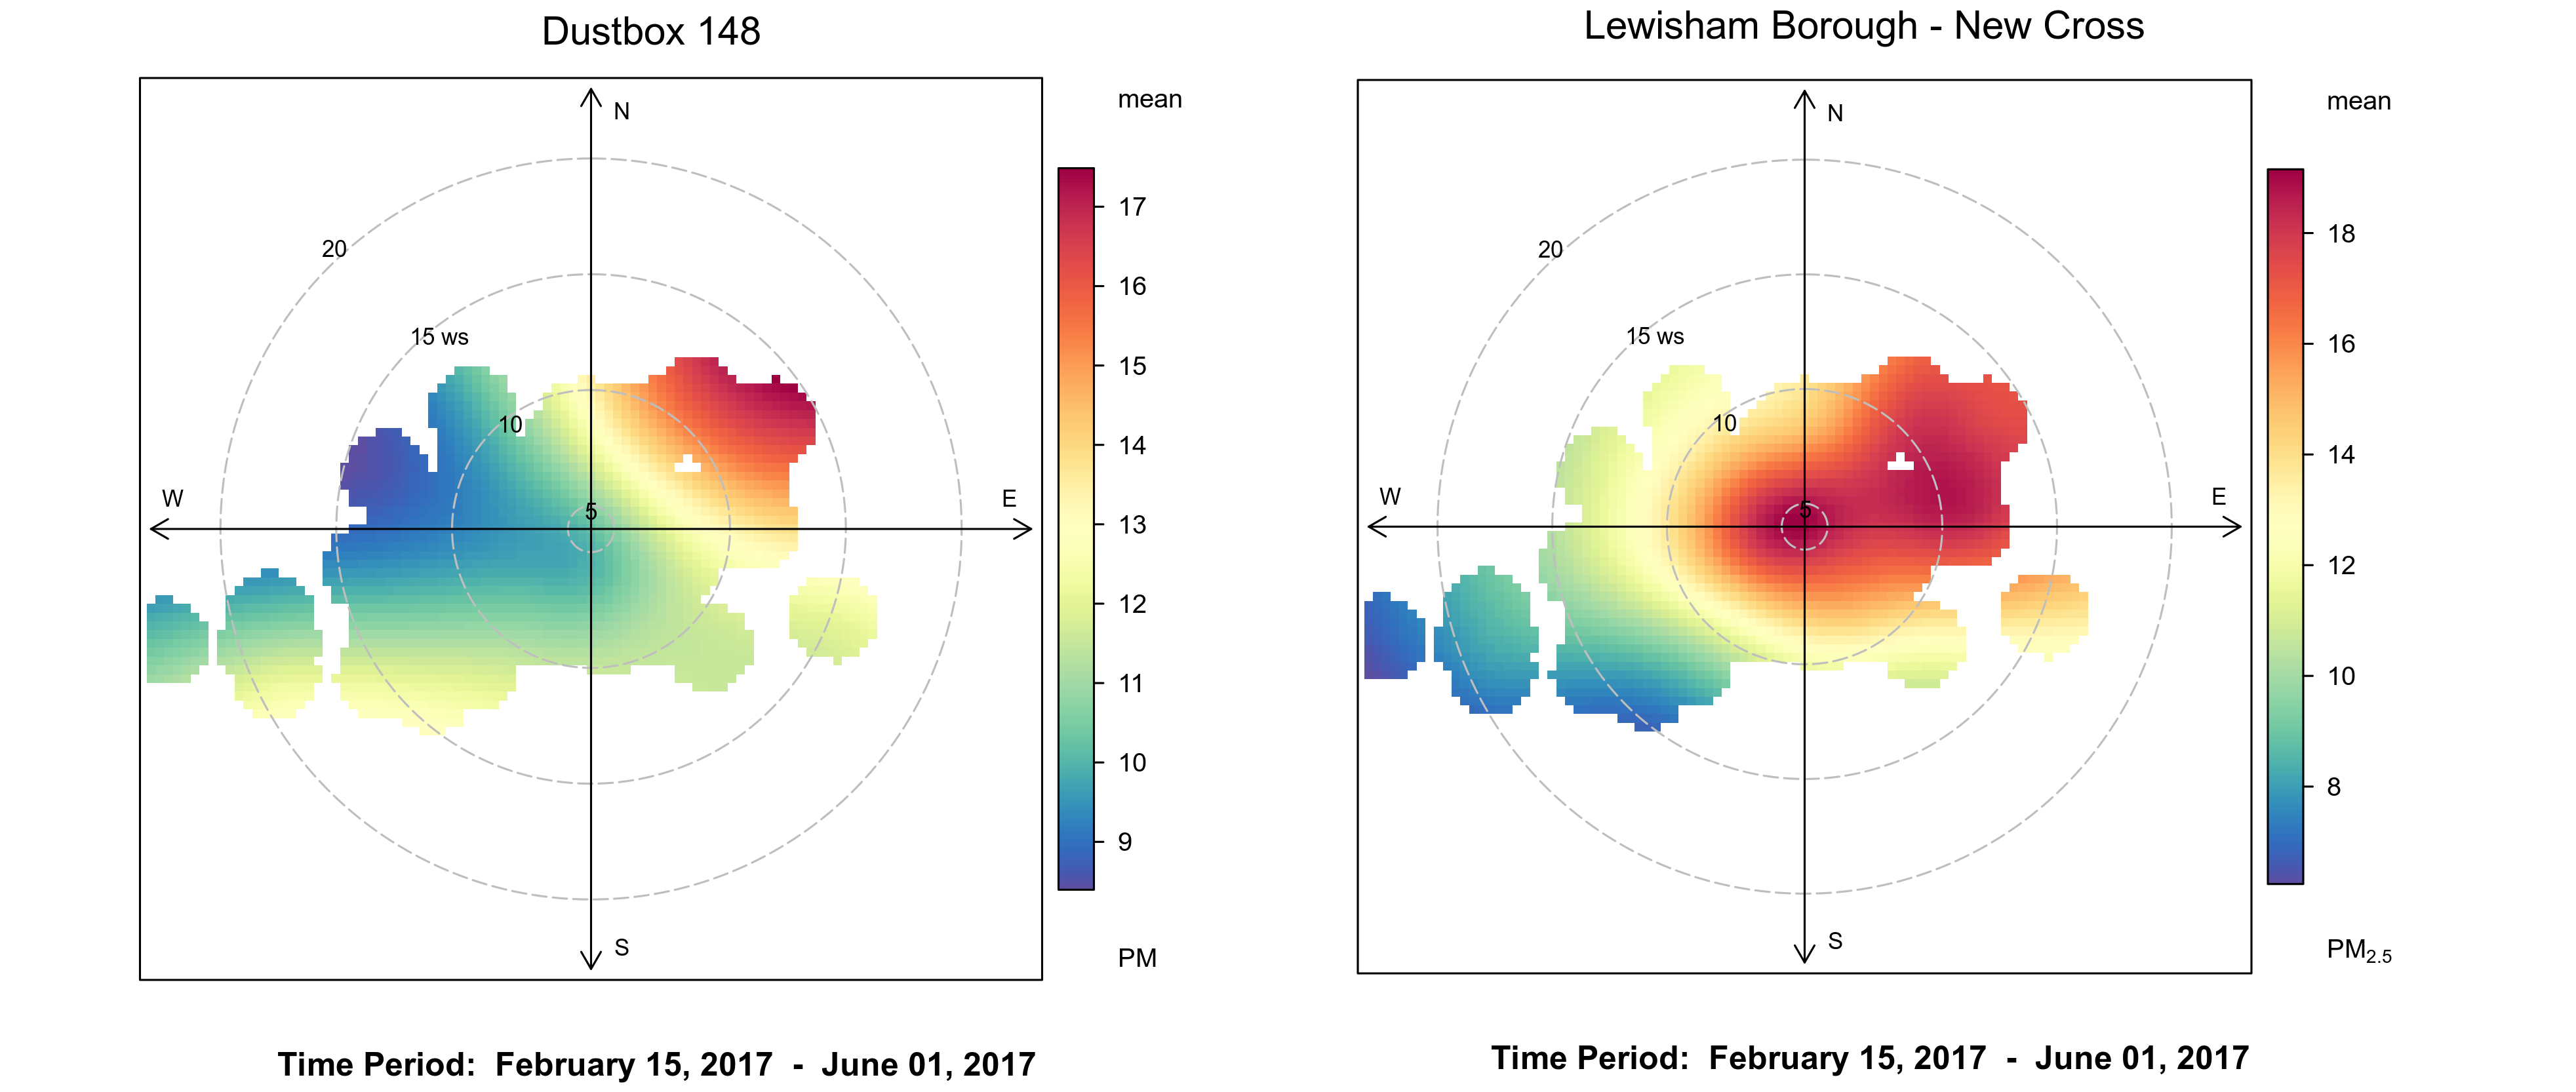
Dustbox 148 displays a somewhat different pattern, where the highest PM2.5 levels are registered in moderate northeasterly winds of between 10 to 15 ms-1. At the same wind speed, intermediate PM2.5 levels can be seen in the southwest and southeast. When wind conditions are calmer, at between 5 to 10 ms-1, emissions are intermediate between the north and east, from approximately 0O to 90O. When winds are low at less than 5 ms-1 emissions levels are also low, suggesting few local emissions sources. As with the two polar plots for Dustboxes 118 and 142, air coming from the northwest is cleaner.
Like Dustbox 148, the LAQN New Cross monitoring station also registers elevated PM2.5 levels to the northeast during moderate winds of 10 to 15 ms-1. However, this LAQN polar plot also offers strong evidence of highly local sources of particulate matter, as levels are still at their highest during low wind speeds of 10 ms-1 and less. Similar to Dustboxes 118 and 142, this LAQN New Cross monitoring station also registers emissions from the southeast during moderate wind speeds of 10 to 15 ms-1. However, these are moderate (rather than high) PM2.5levels. The LAQN monitor registers the cleanest air in westerly and southwesterly winds. Unlike the Dustbox monitors, it registers moderate readings to the northwest.
IV. Drawing the evidence together
Using the tools provided through the Citizen Sense Airsift Data Analysis Toolkit, we have characterized sources of particulate pollution detected in the New Cross area as follows:
- While regional sources of pollution were detected, there was clear evidence of additional local source or sources, most likely related to road traffic, based on the analysis of line graphs and “spike” episodes above shared regional levels in London. However, in comparison to other monitoring locations, New Cross levels of PM2.5 were generally lower overall.
- The strongest local source(s) appear to be to the east, northeast and southeast of the Dustbox 118, 142 and 148 monitoring locations. To the east are several busy thoroughfares with idling traffic, including New Cross Road (A2) and Lewisham Way (the A20) as a likely source of emissions. There is an indication of moderate levels from the Southwest for the 3 Dustbox monitors, although levels are still generally low.
- The elevated levels of PM2.5 identified at Dustbox 142 are strongest during early morning until noon, and the highest mean concentrations occurred on Thursdays, Fridays and Saturdays. These elevated levels are therefore likely to be related to commuter or transit road traffic, as well as lower winds during night-time hours. However, Dustboxes 118 and 142 have slightly different times of elevated pollution, with high morning and evening levels, but lower mid-day and night levels.
- Dustbox 118 and 148 PM2.5 levels are strongest during early evening to end of day, and the highest mean concentrations occurred on Thursdays, Fridays and Saturdays. These elevated levels are therefore likely to be related to commuter or transit road traffic.
- It is clear that traffic has a considerable impact on elevated PM2.5 levels across the New Cross monitoring locations. Local pollution episodes are likely to occur in relation to high levels of traffic. Additional local sources such as construction sites (including demolition, on-site equipment and wind-blown dust), and industry would add to and exacerbate elevated pollution levels.
- There are also common baseline patterns of pollution across these monitors, suggesting a range of sources that contribute to shared elevated PM2.5 levels across London from regional sources.
V. Actions
In relation to the evidence and findings from the Dustbox citizen monitoring study, preliminary actions are proposed here that take into account the neighbourhood context and existing community organisations and initiatives. The key areas for addressing air pollution include transport, construction, vegetation and additional monitoring. These actions have been developed in consultation with monitoring participants and local area residents. Some actions are shared across the 7 data stories, while others are specific to this data story location:
Traffic and transport
- Building on the Lewisham Council Local Implementation Plan, develop a traffic management plan traffic for Deptford and New Cross in order to identify areas to improve pedestrian, cycle and public transport routes, and to understand the potential impact of the Ultra Low Emission Zone (ULEZ) on the area. Address the impact of new development and increasing population in the area, with a realistic projection of the likely numbers of new cars that will be in the area.
- Encourage the use of the River Thames as an alternative transport route for goods, construction and commuters and to reduce road traffic. However, require diesel-free or clean ship fuel to be used by vessels on the River Thames.
- Encourage and support transportation pilots to trial improved roadway design and circulation.
- Improve cycling opportunities in the area, and separate vehicle traffic from cycling traffic, including through the use of car-free green corridors.
- Post signs to encourage no idling. Signs that read ‘Turn your engine off’ and include images of people in pollution masks are more effective than text-only signs that read ‘No idling’.
- Encourage hybrid vehicles and busses, and investigate ways to integrate solar panels into the design of buses and bus stops. Allow for electric vehicle charging points to be requested by residents as part of community transport initiatives, and not only by those who own an electric vehicle.
Construction and development
- Ensure the fulfillment of Air Quality Impact Assessments (AQIAs), both at the planning and implementation stage of new developments, in order to accurately gauge the effect of construction with new developments. Develop adequate monitoring and compliance mechanisms for possible breaches of AQIAs.
- Develop planning and regulatory mechanisms for addressing the accumulative effects from construction and new developments. Impacts from construction and new development can include air pollution from demolition and siteworks, traffic during construction, and higher densities of buildings, people and traffic from new developments. Require that all new developments are ‘air quality neutral’, and ensure transparent and legible processes are in place for ensuring neutrality.
- Join up traffic planning across existing and new developments to facilitate walking, cycling and public transport. Design for neighbourliness with pedestrianized and play streets.
- Encourage cross-borough collaboration on construction and new development. Pending developments at the edge of Deptford, including the Silvertown Tunnel, the Enderby Wharf cruise ferry terminal, the Knight Dragon development at North Greenwich peninsula, and the Royal Docks Enterprise Zone could have a considerable effect on traffic in the area, especially along Evelyn Street.
- Include plans for managing construction traffic as part of providing planning approval for new developments. Ensure that construction traffic does not exceed set levels so as to avoid additional local pollution events.
- Address and prevent the loss of green space and public space due to new development. Green spaces can have a significant mitigating effect on air quality, and also provide a lower emission space in which people can spend time outdoors.
- Provide indicators for how to measure the effectiveness of dust measurement plans and practices at construction sites. Working with the London Low Emission Construction Partnership, provide mechanisms for enforcing dust management plans when they are not adhered to, and for reporting violations.
Green infrastructure
- Require an audit of green spaces in the borough, including an assessment of the suitability of green space as green infrastructure in relation to air pollution mitigation, and in relation to improving walkability and cycleability. Using existing London tree mapping resources, develop a tree plan for planting in the borough, and in relation to best guidance for trees suitable for minimising and lowering air pollution.
- Plant trees and preserve green spaces in relation to air quality guidance for vegetation.
- Investigate opportunities for planting air quality enhancing vegetation in existing neighbourhood green spaces, as well as at schools, hospitals, playgrounds and key community sites.
- Provide guidance on planting for air quality, including preferred species, optimal planting arrangements, and best practices for maintenance.
- Host air pollution monitoring and awareness events in green spaces to raise awareness about the importance of urban design and planning in relation to mitigating and prevent air pollution.
Air quality monitoring
- Prioritise air-quality audits of emission levels at Deptford and New Cross schools, in line with the Mayor of London’s initiative. Expand and provide courses in schools for children to learn about air quality and to undertake air quality monitoring in their local area, including promoting actions for reducing air pollution such as walking to school.
- Provide resources for community organisations and residents to continue to monitor air quality over time in order to assess improvements from preventative and mitigating actions.
- Provide resources to undertake speciation to understand the composition and sources of particulate matter, including from roads, construction and other sources.
- Develop protocols and channels for citizens to provide monitoring data to local and GLA environmental health and planning officers, and require officers to act on identified exceedances in relation to air quality guidelines.
Acknowledgements
The Citizen Sense project is led by Professor Jennifer Gabrys. These data stories were developed working in collaboration with Helen Pritchard and Dr Lara Houston. Thanks are due to our collaborators including:
Dr Benjamin Barratt and Khadija Jabeen at the Environmental Research Group, King’s College, University of London contributed to co-location and calibration of the Dustboxes, and Dr Barratt contributed to the analysis of the data stories.
Lau Thiam Kok contributed to the co-development of the Citizen Sense Airsift Data Analysis Toolkits, using and adapting openair software developed by Dr David Carslaw.
Raphael Faeh contributed to the digital design and layout of the “Pollution Sensing” data stories, which provided a model for these “Urban Sensing” data stories.
The Citizen Sense Dustbox included contributions to the printed circuit board design, which was developed in collaboration with Adrian McEwen of MCQN Ltd, and to the ceramic housing, which was rendered into 3D-printable format in collaboration with materials designer Francesca Perona.
Special thanks are due to the participants and residents in southeast London who contributed to the development and testing of the Dustbox monitoring kit, as well as to the collection and analysis of data, and communication of results to wider publics and regulators. For more information on project contributors, see Citizen Sense People.
These data stories are generated using the Citizen Sense Airsift Data Analysis Toolkit, which was developed to allow for citizen-led interpretation of datasets. The core data available for interpretation is the Dustbox PM2.5 sensor data. The Airsift toolkit also brings in air quality data from select sites in the London Air Quality Network (LAQN) for comparison with the citizen data.
In order to blur the exact monitoring locations, the monitoring locations are shown with large blue circles to indicate the approximate monitoring location. Additional citizen monitoring locations are anonymous, and are not included on the Airsift map.
At the start of the monitoring period, the Dustboxes were co-located with the Marylebone Atmospheric Observatory, and a scaling factor was applied to calibrate the devices. Because the sensors were co-located and calibrated during a time of low to moderate pollution, the scaling factor could slightly amplify higher readings in relation to the LAQN readings. However, this would require further testing to demonstrate, since when comparing Dustbox levels with nearby LAQN levels (where available), readings are often comparable.
This data story is prepared under the assumption that all pollutant, cartographic and meteorological measurements are valid and not sufficiently biased to cause misrepresentation of results. Please refer to the Airsift Data Analysis Toolkits and Terms of Use for further information.
The research leading to these results has received funding from the European Research Council under the European Union’s Seventh Framework Programme (FP/2007-2013) / ERC Grant Agreement n. 313347, “Citizen Sensing and Environmental Practice: Assessing Participatory Engagements with Environments through Sensor Technologies.”
To cite this data story, please use the reference: Citizen Sense (2017) “New Cross,” Deptford Data Stories, 14 November. Available at: https://datastories-deptford.citizensense.net/new-cross.
This New Cross data story is also available to download as a PDF.