The New Cross Gate area is the most westerly part of the citizen monitoring network, and is marked by several major traffic intersections and key thoroughfares for South East London. The area includes a mix of housing, cultural spaces, shops, community green spaces, as well as Goldsmiths, University of London. Key findings show that pollution levels are high near major roads, but are considerably lower on pedestrianized streets and within well planted community gardens.
This data story details below how citizen data, weather data and local observations reveal these specific pollution patterns. Drawing on workshops with local residents, the data story also suggests how best to address the problem, from planning for better transport to building on the success of community green spaces and pedestrian streets in the area.
I. The Location
The New Cross Gate monitoring location, which includes Dustboxes 108, 123, 133 and 149, is located to the west of the Goldsmiths, University of London campus. It is characterised by several busy roads that cross southeast London, as well as a railway with predominantly electric trains, which connects New Cross Gate with central London.
There are several schools in the area, and land use is primarily residential, with localised concentrations of shops, cultural centres and restaurants, as well as a large Sainsbury’s store and shopping centre. There are several additional large shopping centres along the Old Kent Road to the northwest of the monitoring area. The Southeast London Combined Heat and Power (SELCHP) incinerator is just to the north of the monitoring location. The New Cross Gate bus garage is located on the southeast edge of the monitoring location.
The New Cross Gate area, along with Deptford, is a site of ongoing development and redevelopment, with construction sites located at the periphery of this immediate area. On the whole, the primary emission-causing activities in the New Cross Gate location consist of transport-related emissions.
In total, 30 monitors were distributed to participants. The monitoring period ran for over 9 months, until September 2017. During peak monitoring activity, there were 21 active Dustboxes.
Local sources of particulate pollution
The below map indicates the approximate monitoring locations of the Dustboxes. Dustbox 108 is located on a fourth-floor balcony that faces onto a pedestrianized street and small park. Dustbox 133 is situated on a flat roof near a main road, monitoring discontinuously on a battery pack. Dustbox 149 is located in a garden, sheltered within a DIY Stevenson screen under flowering bushes and near to a compost heap. Dustbox 123 is in relatively close proximity to the New Cross Bus Garage.
The map shows possible emissions sources in the local area, most prominently roads. New Cross Road (A2) is located 85 metres to the southwest of Dustbox 108, and 3 metres to the southwest of Dustbox 133. Dustbox 149 is located in a residential area and on a pedestrian street, but with two larger roads nearby: Queen’s Road (A202) 120 metres to the south, and Pomeroy Street (B2227) 120 metres to the west. Since Dustbox 123 is located at the exit to the New Cross Gate Bus Garage, bus traffic is likely to be a possible emissions source at this monitoring site.
London-wide, regional and global sources of particulate pollution
Particulate matter sources in London can be attributed to a broad range of emissions. Within London, PM2.5 from transport (particularly diesel), industry, construction, cooking and heating all contribute significantly to London-wide levels. A significant amount of PM2.5 emissions also comes from heavy industry and agriculture outside the UK, particularly France, Belgium, the Netherlands, Luxembourg, Germany and Poland. These emissions are thought to account for an urban background of approximately 10 µg/m3. The importance of these transboundary effects of PM2.5 emissions from outside of the UK on the total London PM2.5 can vary between 40% to 80% daily depending on weather conditions. When long-range pollution episodes do occur in London, they are generally carried on easterly winds. There are a number of global emissions, events and practices that contribute particulate matter to the total London PM2.5, including fuel production, industrial and domestic combustion, transportation, waste disposal, and agriculture, although these are harder to quantify.
Observations
Most participants reported observing constant idling traffic on the A2, especially around the junction with Queen’s Road. One participant noted that there was often heavy truck traffic on the road from 5 am onwards, and the idling traffic was often more intensive on Deptford market days. One of the participants also noted that the street was often filled with smoke from the local BBQ café adjacent to their residence (and monitoring location). One of the participants who cycles noted that as they descended into New Cross from Crystal Palace on some mornings they observed a thick grey soup. In addition, on some mornings as they had cycled through New Cross they experienced weeping eyes, and so they had purchased a mask for cycling as a precautionary measure, although found this was largely ineffective.
II. Is there evidence of a problem?
The device used to monitor PM2.5 is an “indicative” monitor. This means that measurements can give an indication of pollutant concentrations, but cannot be directly compared with national and international guidelines and standards in an “official” or regulatory sense. Despite this, indicative monitoring is a well-established method within atmospheric science for carrying out initial surveys of an area to establish whether a potential problem merits further investigation. Indicative monitors are also becoming increasingly available for citizen-based air-quality monitoring, similar to this study. Where possible, the Dustboxes were co-located at the start and the end of the study to account for differences in the sensors and drift during the monitoring period.
Dustbox monitoring at the New Cross Gate location generated data from late November 2016 to early August 2017, although different monitors were active at different times. Indicative daily mean concentrations of PM2.5 for monitors 108 and 123 between December 2016 and February 2017 are provided in Figure 1.

The World Health Organisation (WHO) has established a 24-hour mean guideline for PM2.5 of 25 µg/m3 (although there is no safe level of exposure). The time series graphs below show that the WHO guideline was regularly exceeded at Dustboxes 108 and 123 between December 2016 and February 2017, and occasionally was exceeded in the months following.
The PM2.5 levels registered by Dustboxes 108 and 123 were elevated across the entire monitoring period. However, in the months of December, January and February, there were more days that exceeded the WHO 24-hour mean guideline of 25 µg/m3 than days that were within the guideline There were lower PM2.5 levels recorded during March, April and May, when fewer than half of days were over the WHO guideline. Dustbox 133 was run using a battery pack gathering intermittent data, but the recorded readings also fit this pattern.

Dustbox 149, a monitor located in a sheltered garden and on a pedestrianized street, was activated later in the monitoring period than the other three Dustboxes. It ran from March 2017 until early August 2017. As Figure 2 above illustrates, Dustbox 149 registered much lower emissions levels overall, showing no exceedances of the WHO guideline during this monitoring period. Dustbox 149 is compared here to the LAQN Greenwich Eltham site, which is an urban background location, to show that monitoring locations away from roadsides can have noticeably lower levels of pollution.
These indicative findings suggest that further research could be warranted. It is useful to determine when these monitors are registering local sources of emissions (within approximately 300 metres of the sensor), and when they are documenting regional sources that are further away, as well as capturing other phenomena such as unusual weather conditions occurring across London.
There are many possible sources of pollution in the area, and we have to look at the measurements more closely to see if we can deduce which activities are causing these spikes. Knowing the source of pollution is important as some activities produce more toxic particulate matter than others, and actions to mitigate sources should be targeted to the cause of the problem.
Enlarge
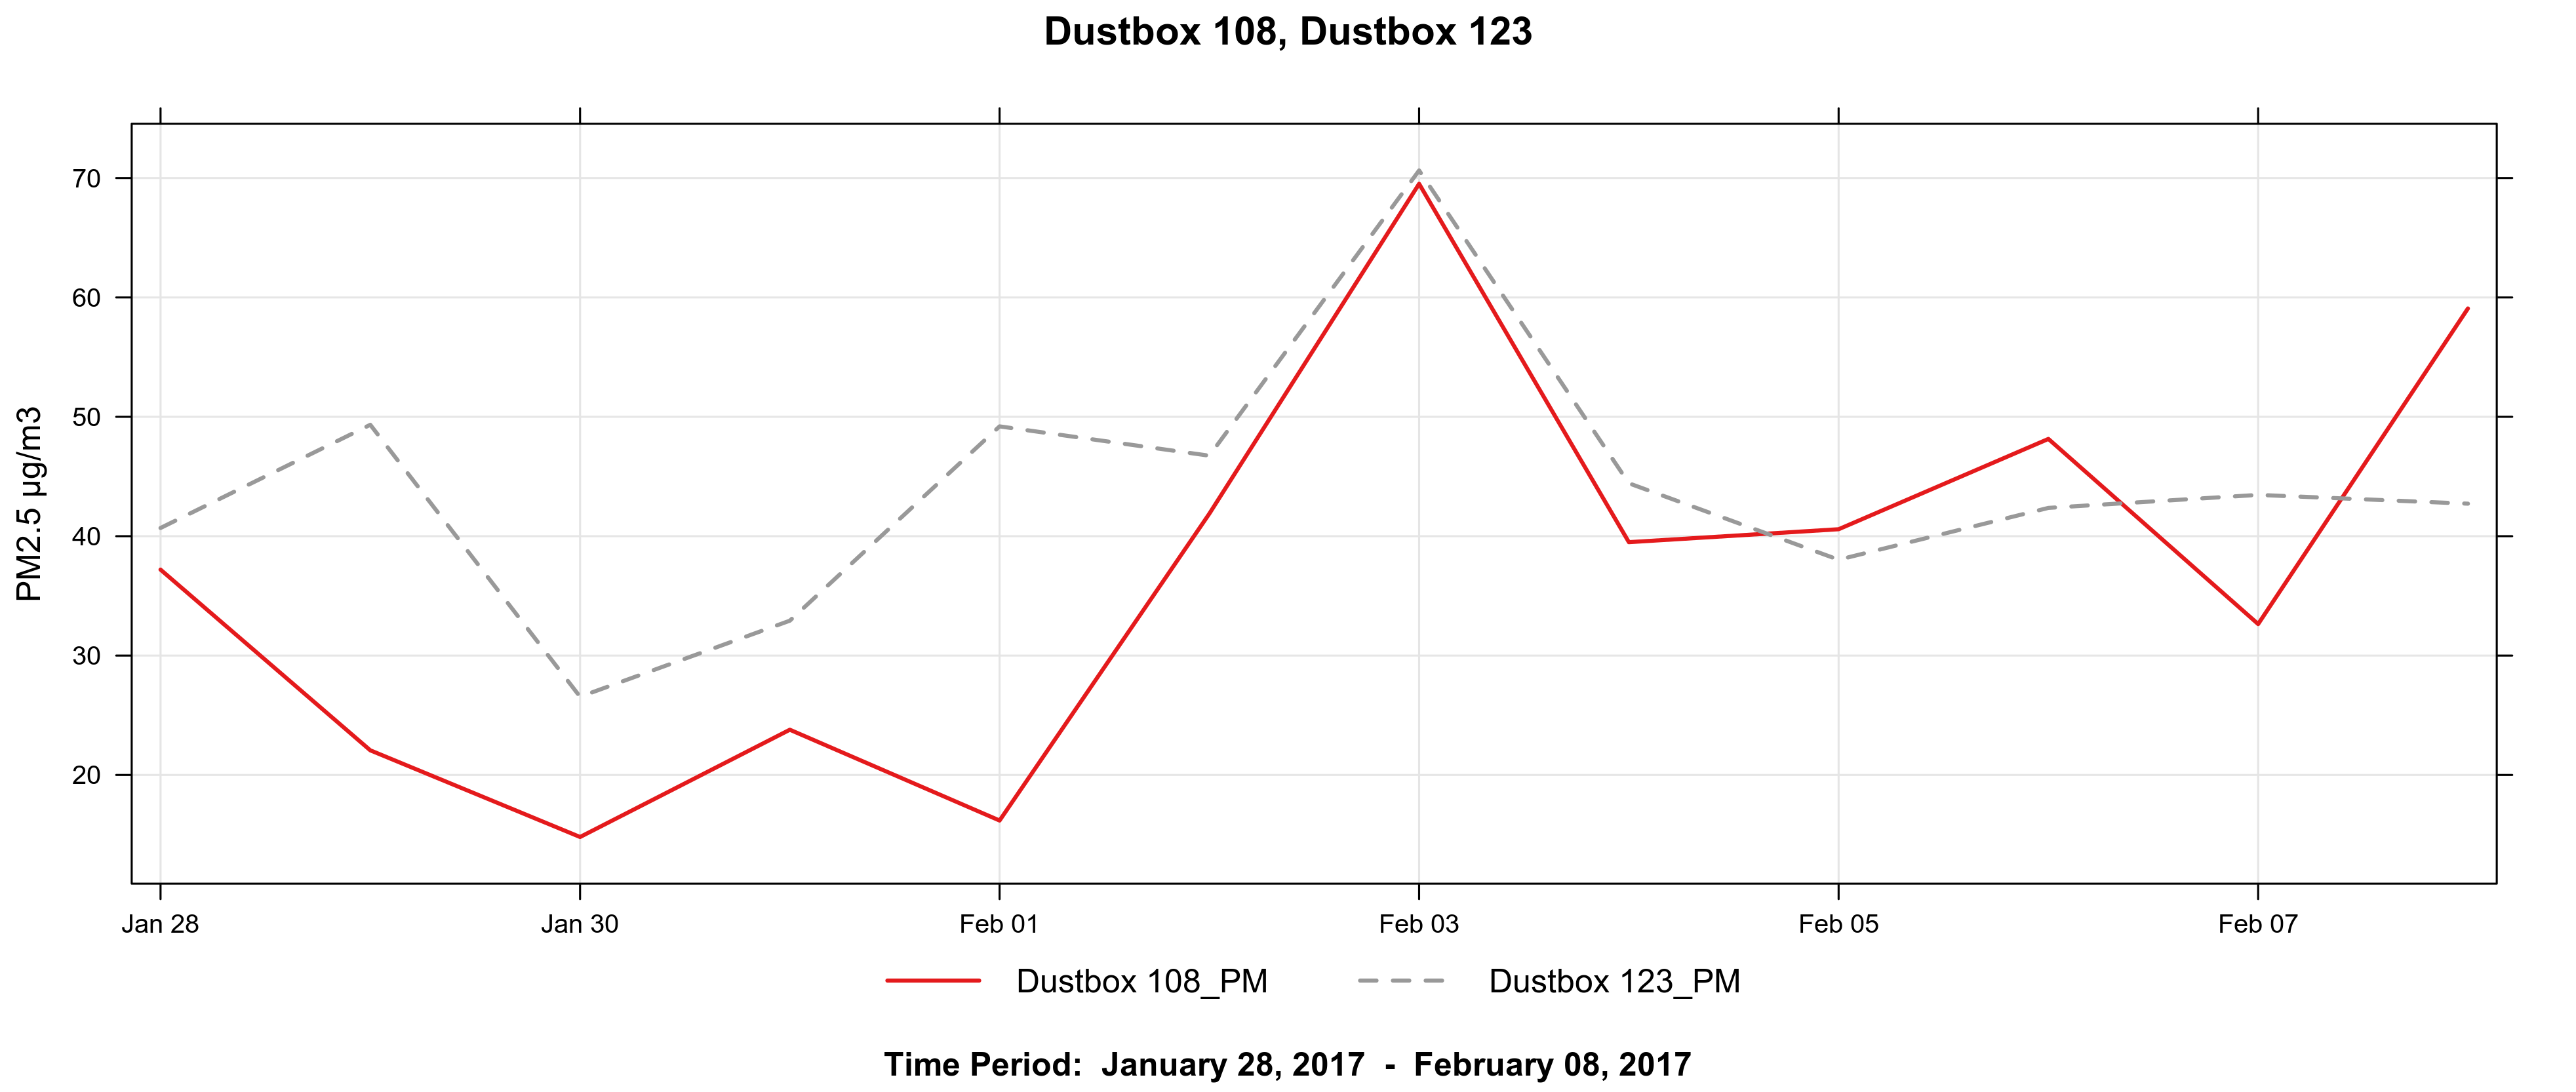
Figure 3 has been plotted to analyse PM2.5 levels outside of the city-wide pollution events that were experienced during January and February 2017. However, even when analysing data outside of these peak events, the Dustbox data indicates relatively high levels, particularly for Dustbox 123. These patterns suggest that local sources of emissions could be registering on the monitors.
Enlarge
Enlarge
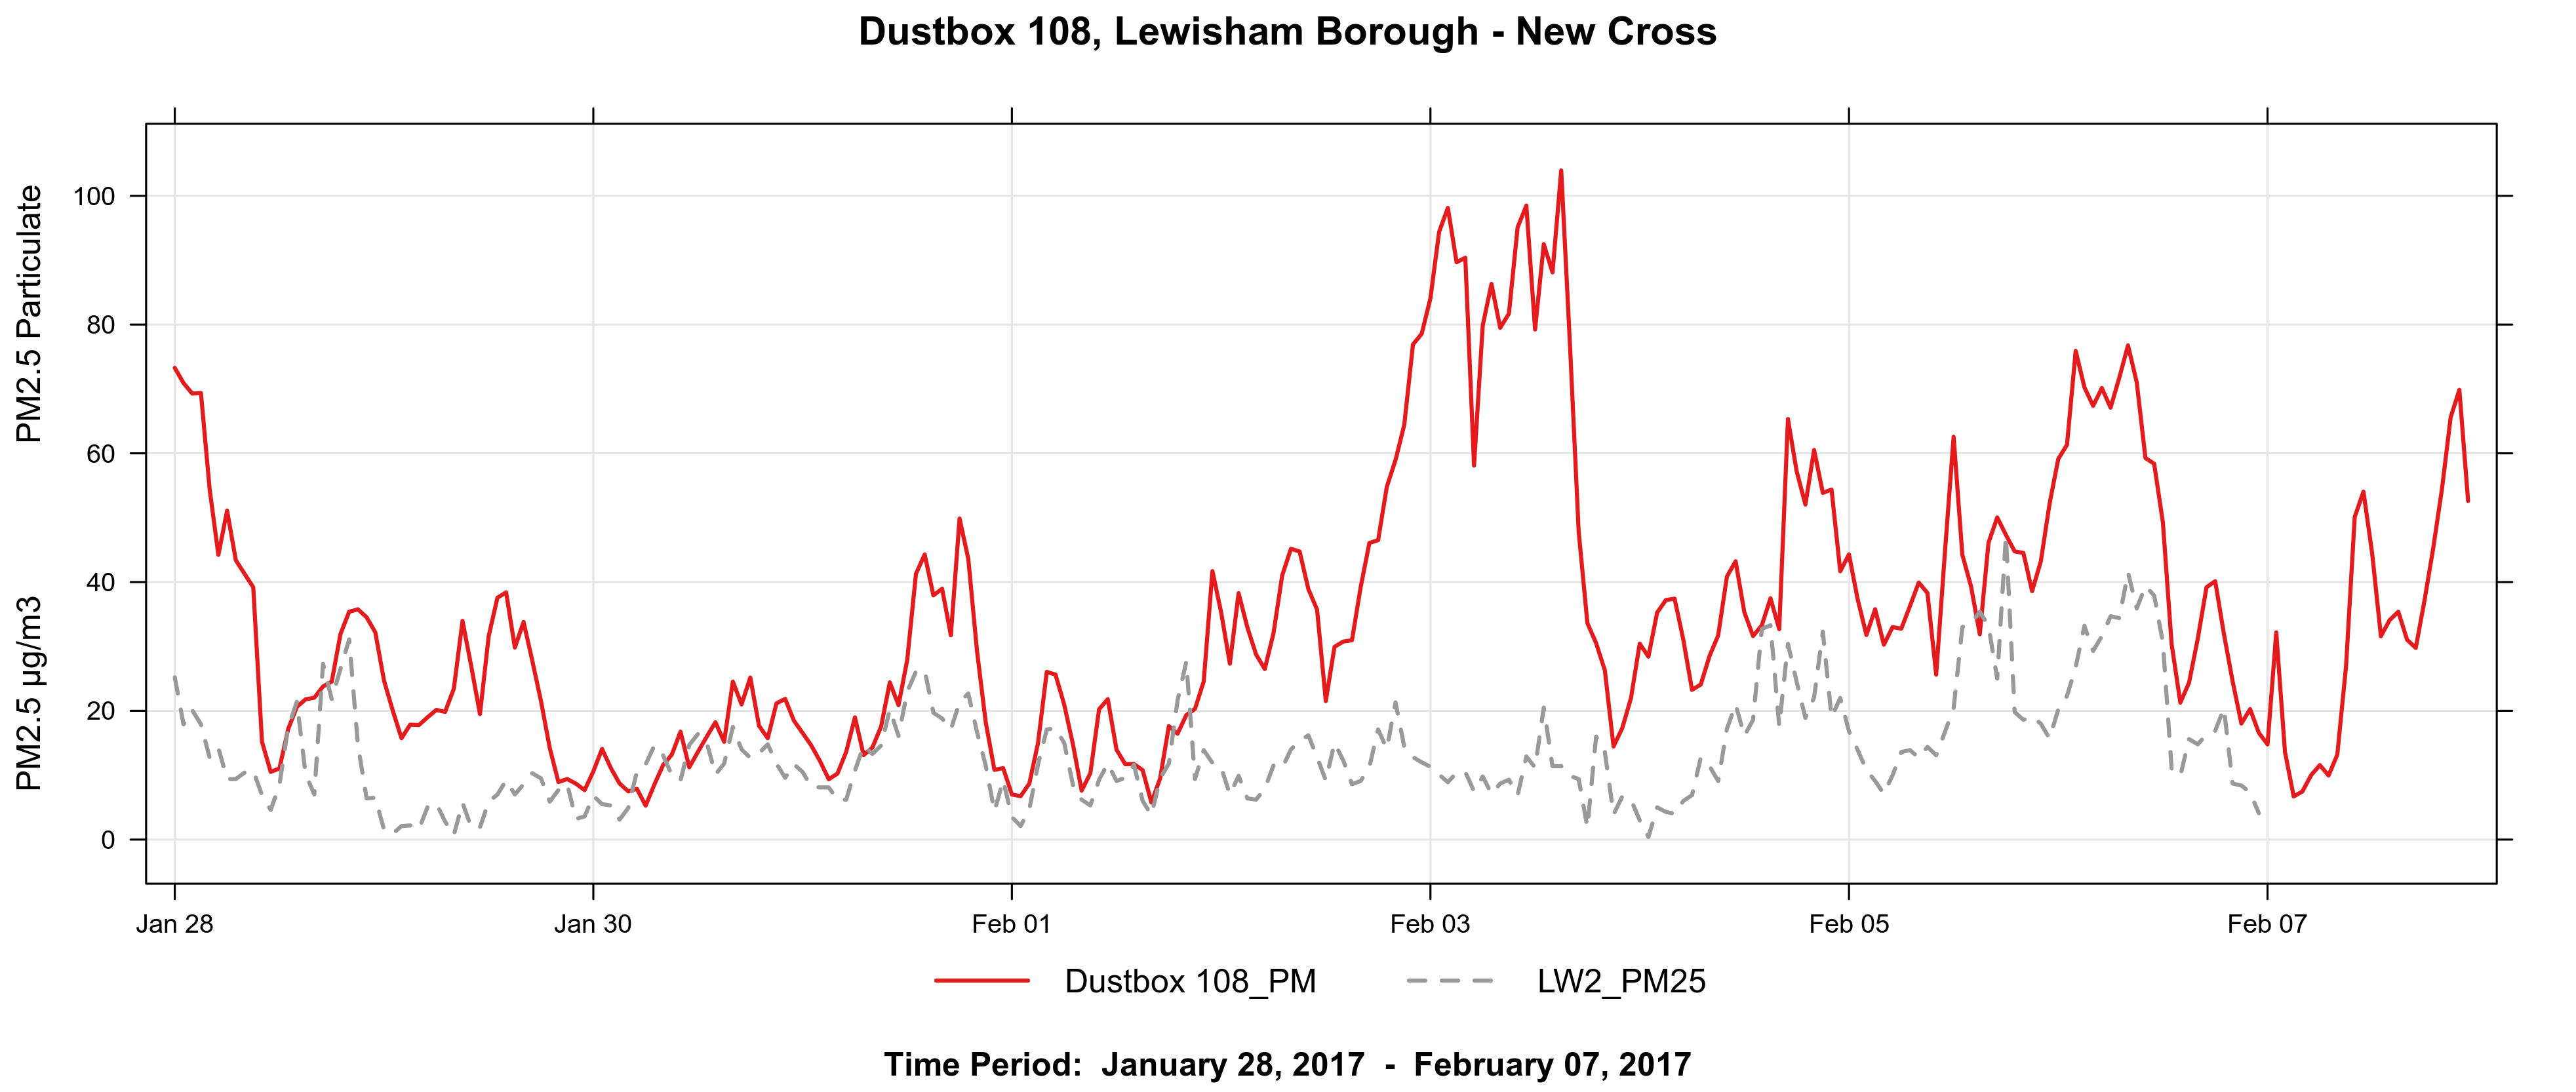
One source of information on London-wide pollution events is the city’s statutory monitoring infrastructure, the London Air Quality Network (LAQN). The LAQN provides pollution alerts to citizens, and keeps records of episodes of high pollution in the capital. New Cross Gate is home to an LAQN monitoring station for PM2.5 that sits on the roadside, approximately 3 metres south of New Cross Road (A2).
In Figure 4a above, Dustbox 108 and the LAQN New Cross Gate monitoring station share some similar spikes, suggesting shared local emissions sources in the New Cross Gate area. In addition, Dustbox 108 shows spikes of particulates in the form of raised humps on the line graph. These humps indicate elevated levels of pollution, where spikes on top of broader levels indicate that local pollution sources could be adding to regional sources.
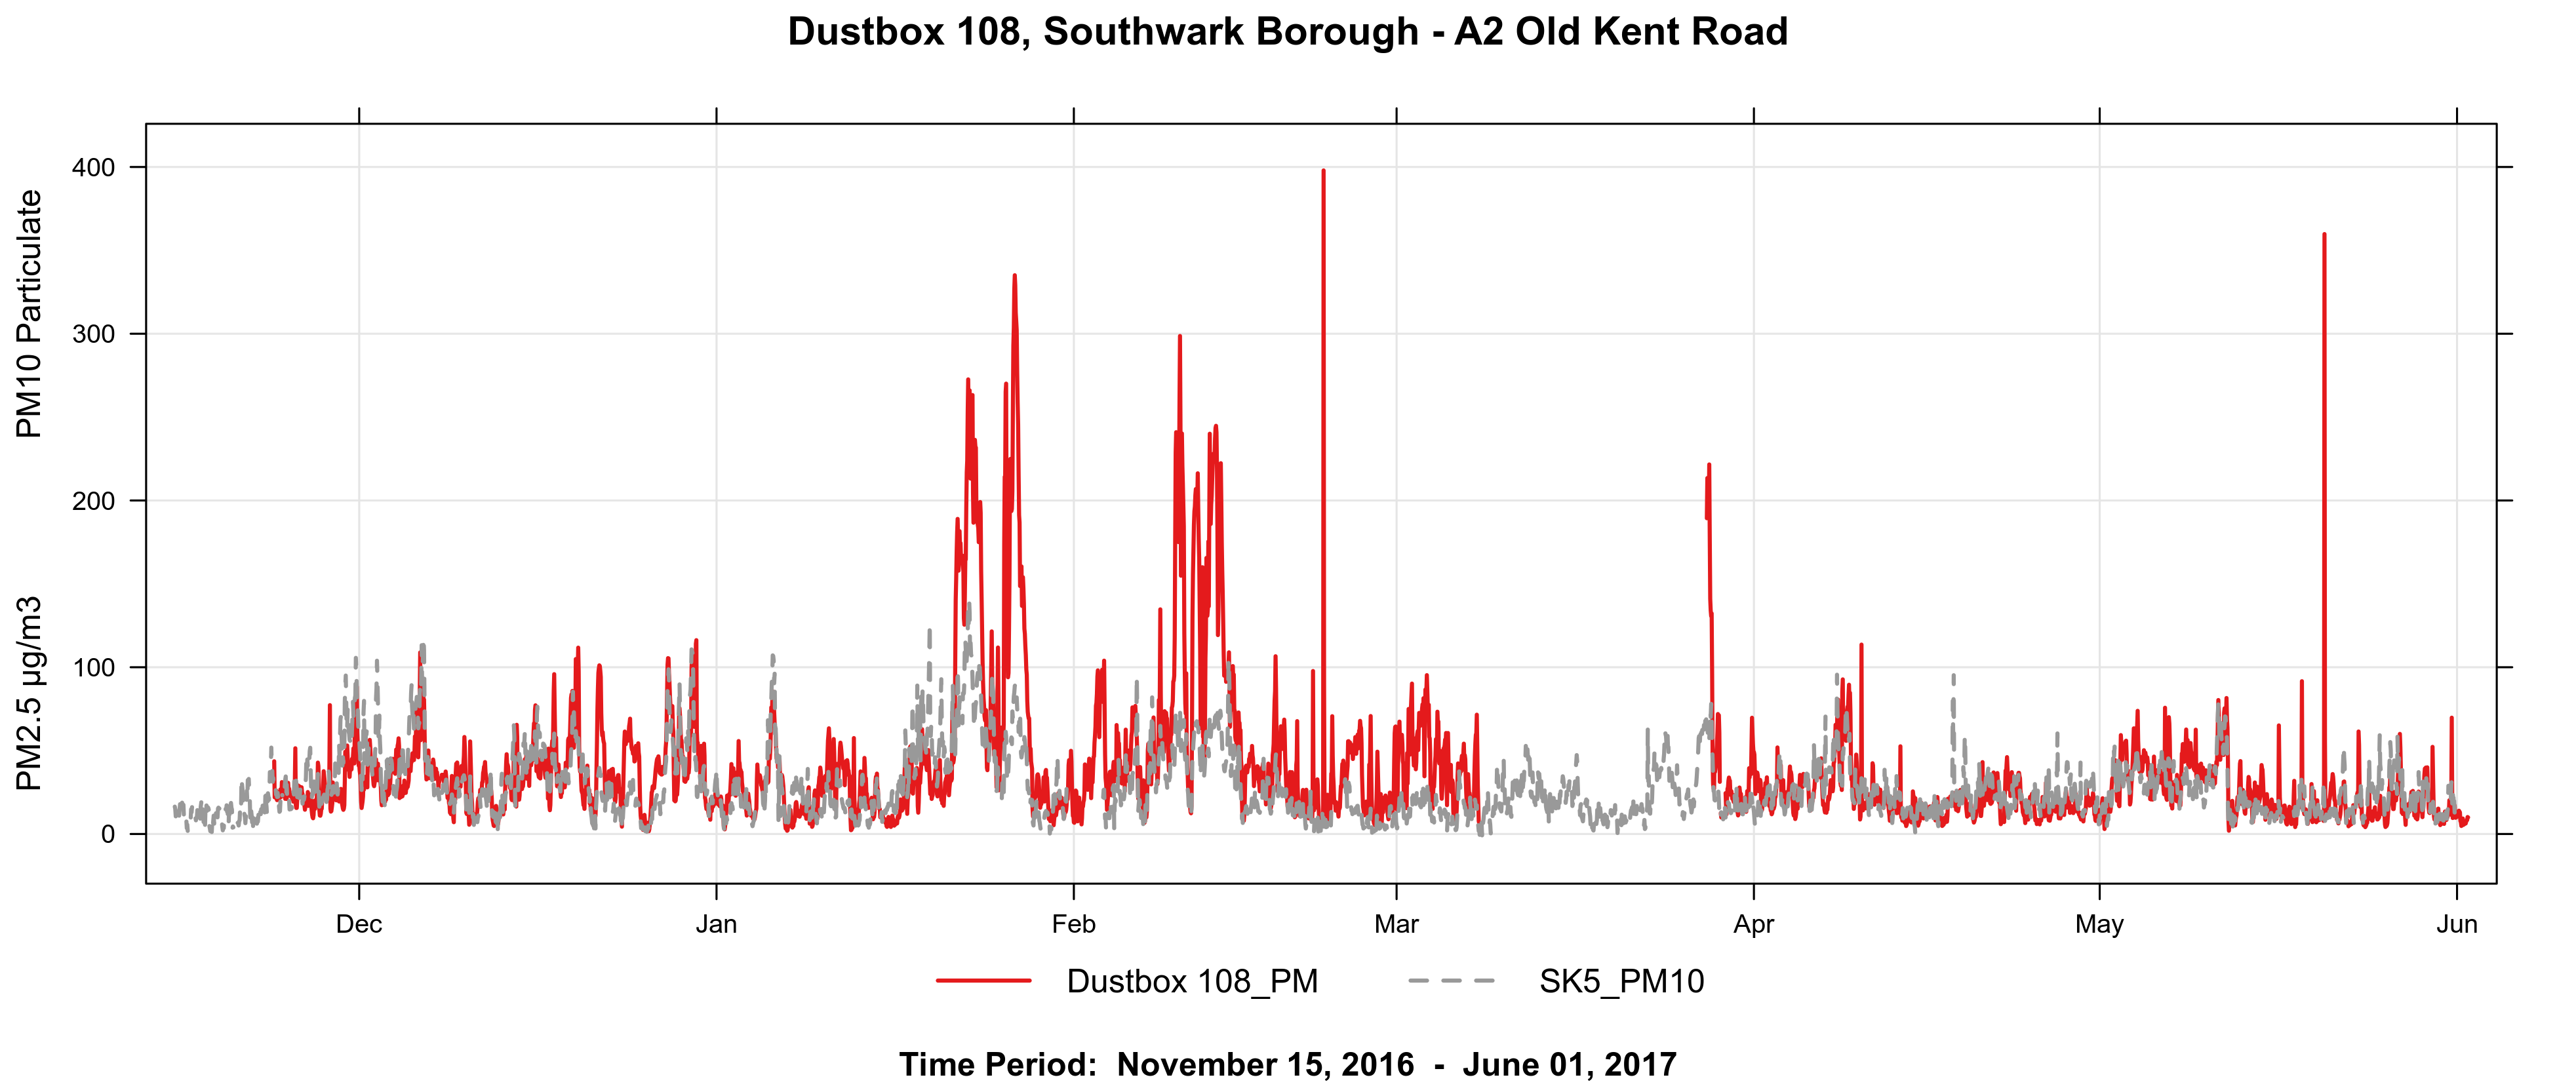
Figure 4b compares Dustbox 108 and the LAQN Southwark Old Kent Road monitoring station (a monitor that is also in the Automatic Urban and Rural Network (AURN) run by DEFRA).While the Southwark Old Kent Road station monitors particulate matter 10 (PM10) and does not include data for PM2.5, nevertheless there is broad agreement between the two monitors, with elevated episodes of PM2.5 evident at the Dustbox 108 location. The WHO 24-hour guideline for PM10 is 50 µg/m3, which is also clearly exceeded on a number of occasions, in addition to the exceedances of PM2.5 at 25 µg/m3.
Enlarge
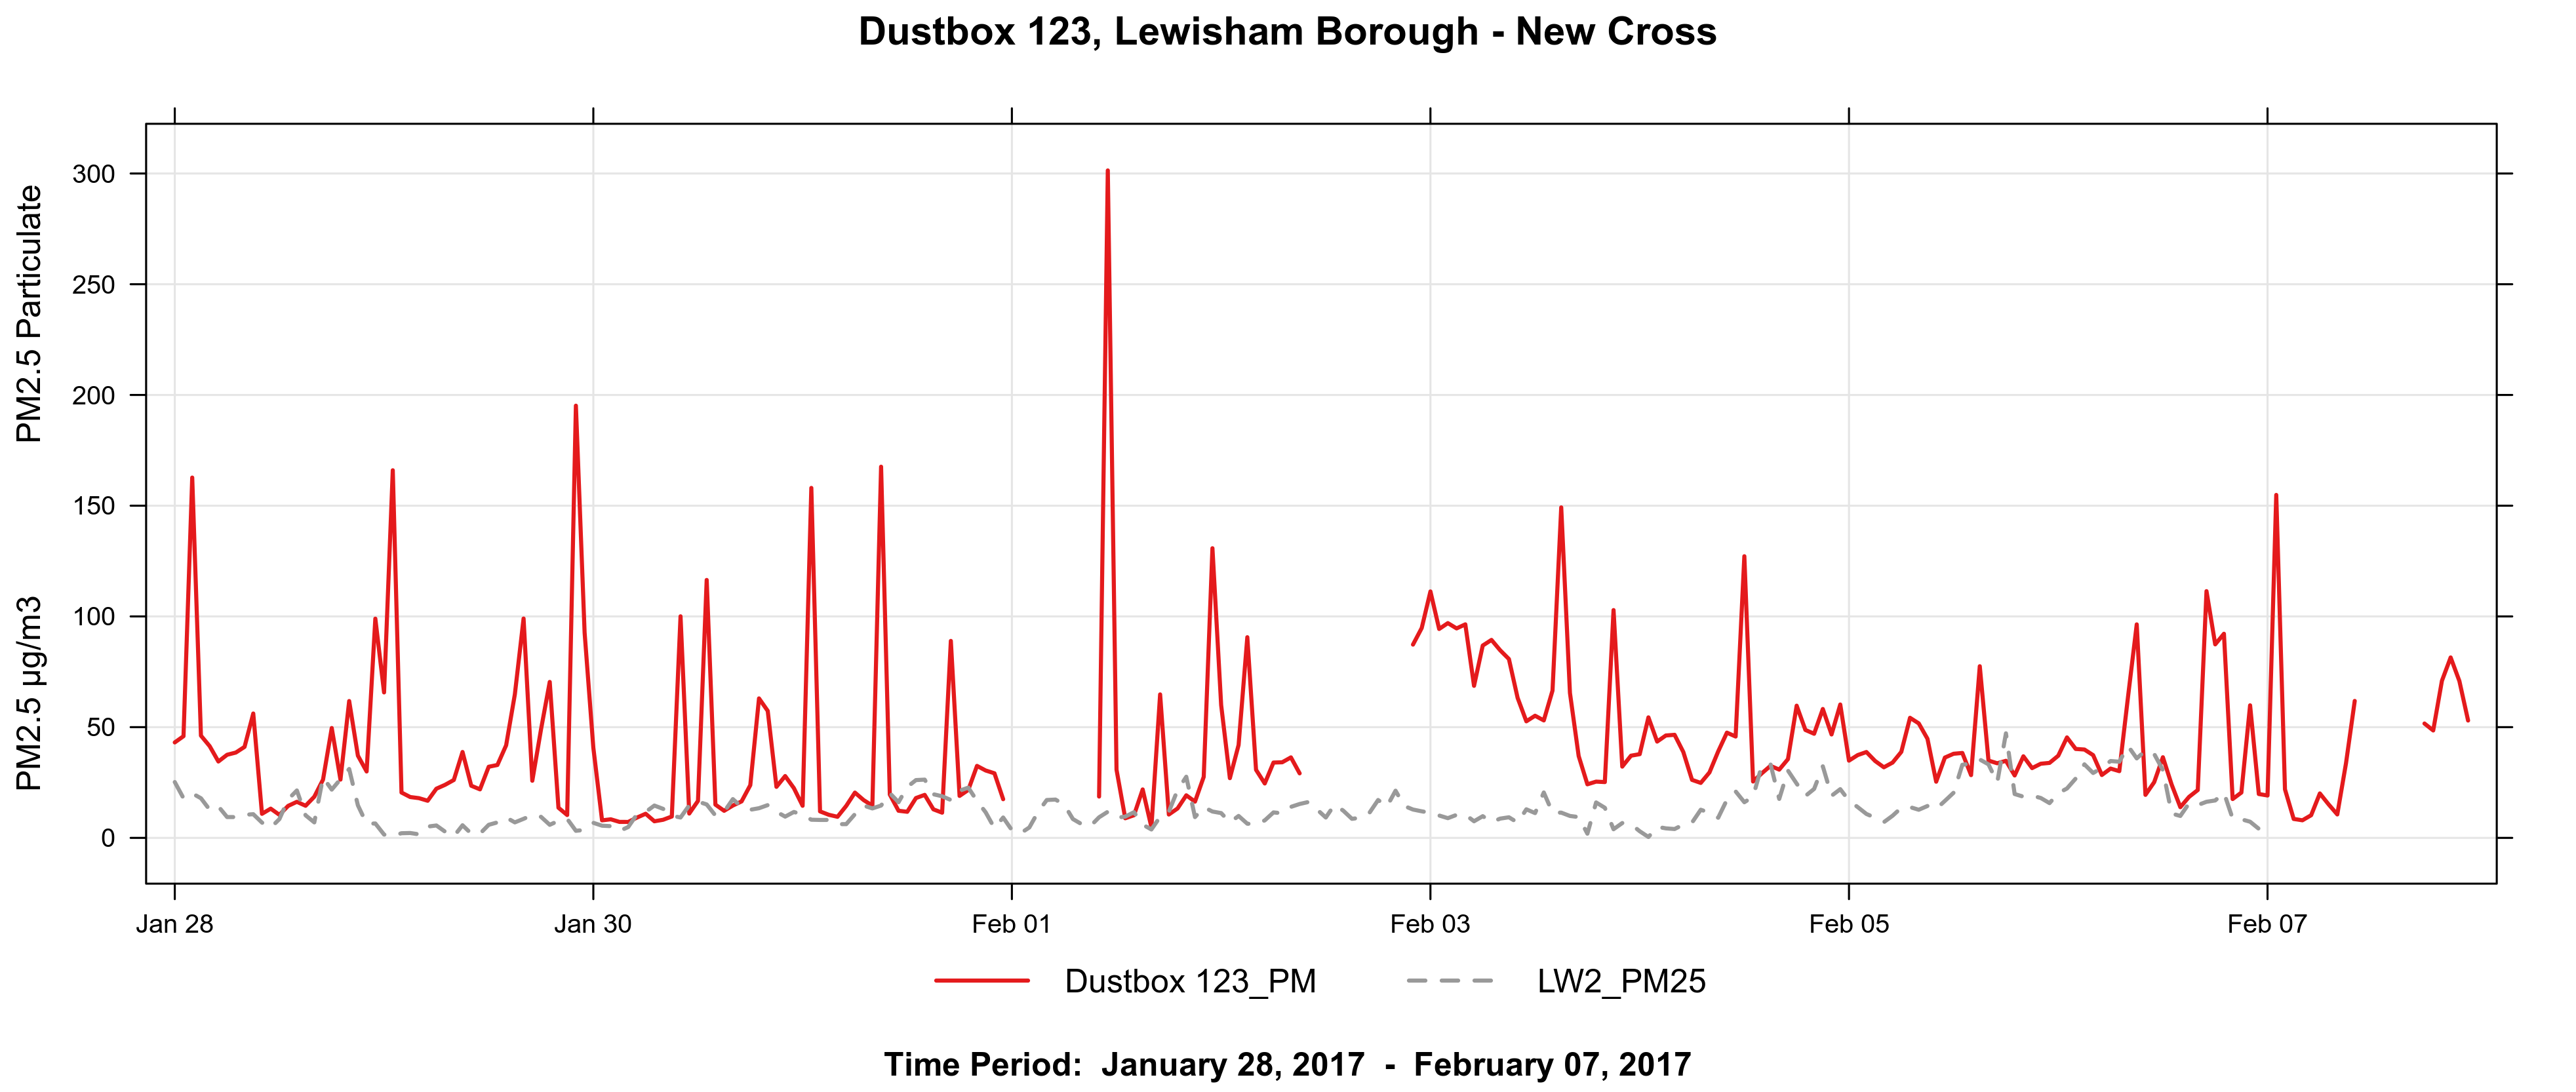
Figure 5 indicates that Dustbox 123 generally shows humps that are different from the LAQN New Cross Gate monitor. Additionally, it shows regular and quite distinctive spikes, which suggest a different local emissions source. Further study would be warranted to determine the source of these emissions.
III. Characterizing the problem
When is the source most evident?
Using time plots, it is possible to analyse time of day and day of week, as well as month, when pollution levels are elevated. Time plots aggregate PM2.5 concentrations according to time, so that key patterns such as rush hours and traffic, as well as possible construction or industry sources, along with regional pollution events due to seasonal variation, are evident.

Known sources of pollution in London, for example coming from transportation, construction and heating, tend to follow recognizable temporal patterns during the daytime and the working week, for instance with higher levels during rush hours, and lower levels on Sundays. Figure 6 does not show clear traffic-related patterns for days of week, however, as patterns on Sundays are higher than those recorded on Tuesdays. This is perhaps to be expected given that the monitoring period includes multiple London-wide pollution events. However, Figure 6 does show a more familiar hourly pattern of peaks during morning and evening rush hour periods.
Enlarge

Figure 7 shows a similar pattern for Dustbox 123 in comparison to Dustbox 108. This time chart shows an hourly pattern of morning and evening peaks. It also displays a similar lower level on Tuesdays, although it should be noted that an average of 42 µg/m3 is still considerably above the WHO guideline of 25 µg/m3 for a 24-hour mean concentration. The daily aggregations across the week show a flatter pattern in comparison to Dustbox 108, with sporadic peaks on Mondays, Wednesdays and Saturdays.
Because Dustbox 133 was run on a battery pack, it is less suitable for a time plot analysis, as it does not have a consistent hourly or daily dataset. Dustbox 133 has not been included in the time plot analysis for this reason.
As Dustbox 149 was not activated until March 2017, Figure 8 below shows a different date range, from 1 March to 1 August 2017.
Enlarge

In this Dustbox data we can see very clearly that higher emissions levels are recorded during the working week. Otherwise, the highest emissions are recorded in the early morning, and from evening onwards, with a pronounced dip in emissions around noon. This is similar to the patterns from nearby Dustboxes 118 and 148 in New Cross. However, emissions are considerably lower at this location, and are well below the WHO 24-hour guideline.
Which direction is PM2.5 coming from?
Wind direction has a considerable influence on pollution measurements. A sensor will only record emissions from a particular source or activity if the wind blows it from the source towards the sensor. Therefore, we can investigate where a source of pollution is likely to be located by plotting wind direction against pollution concentrations.
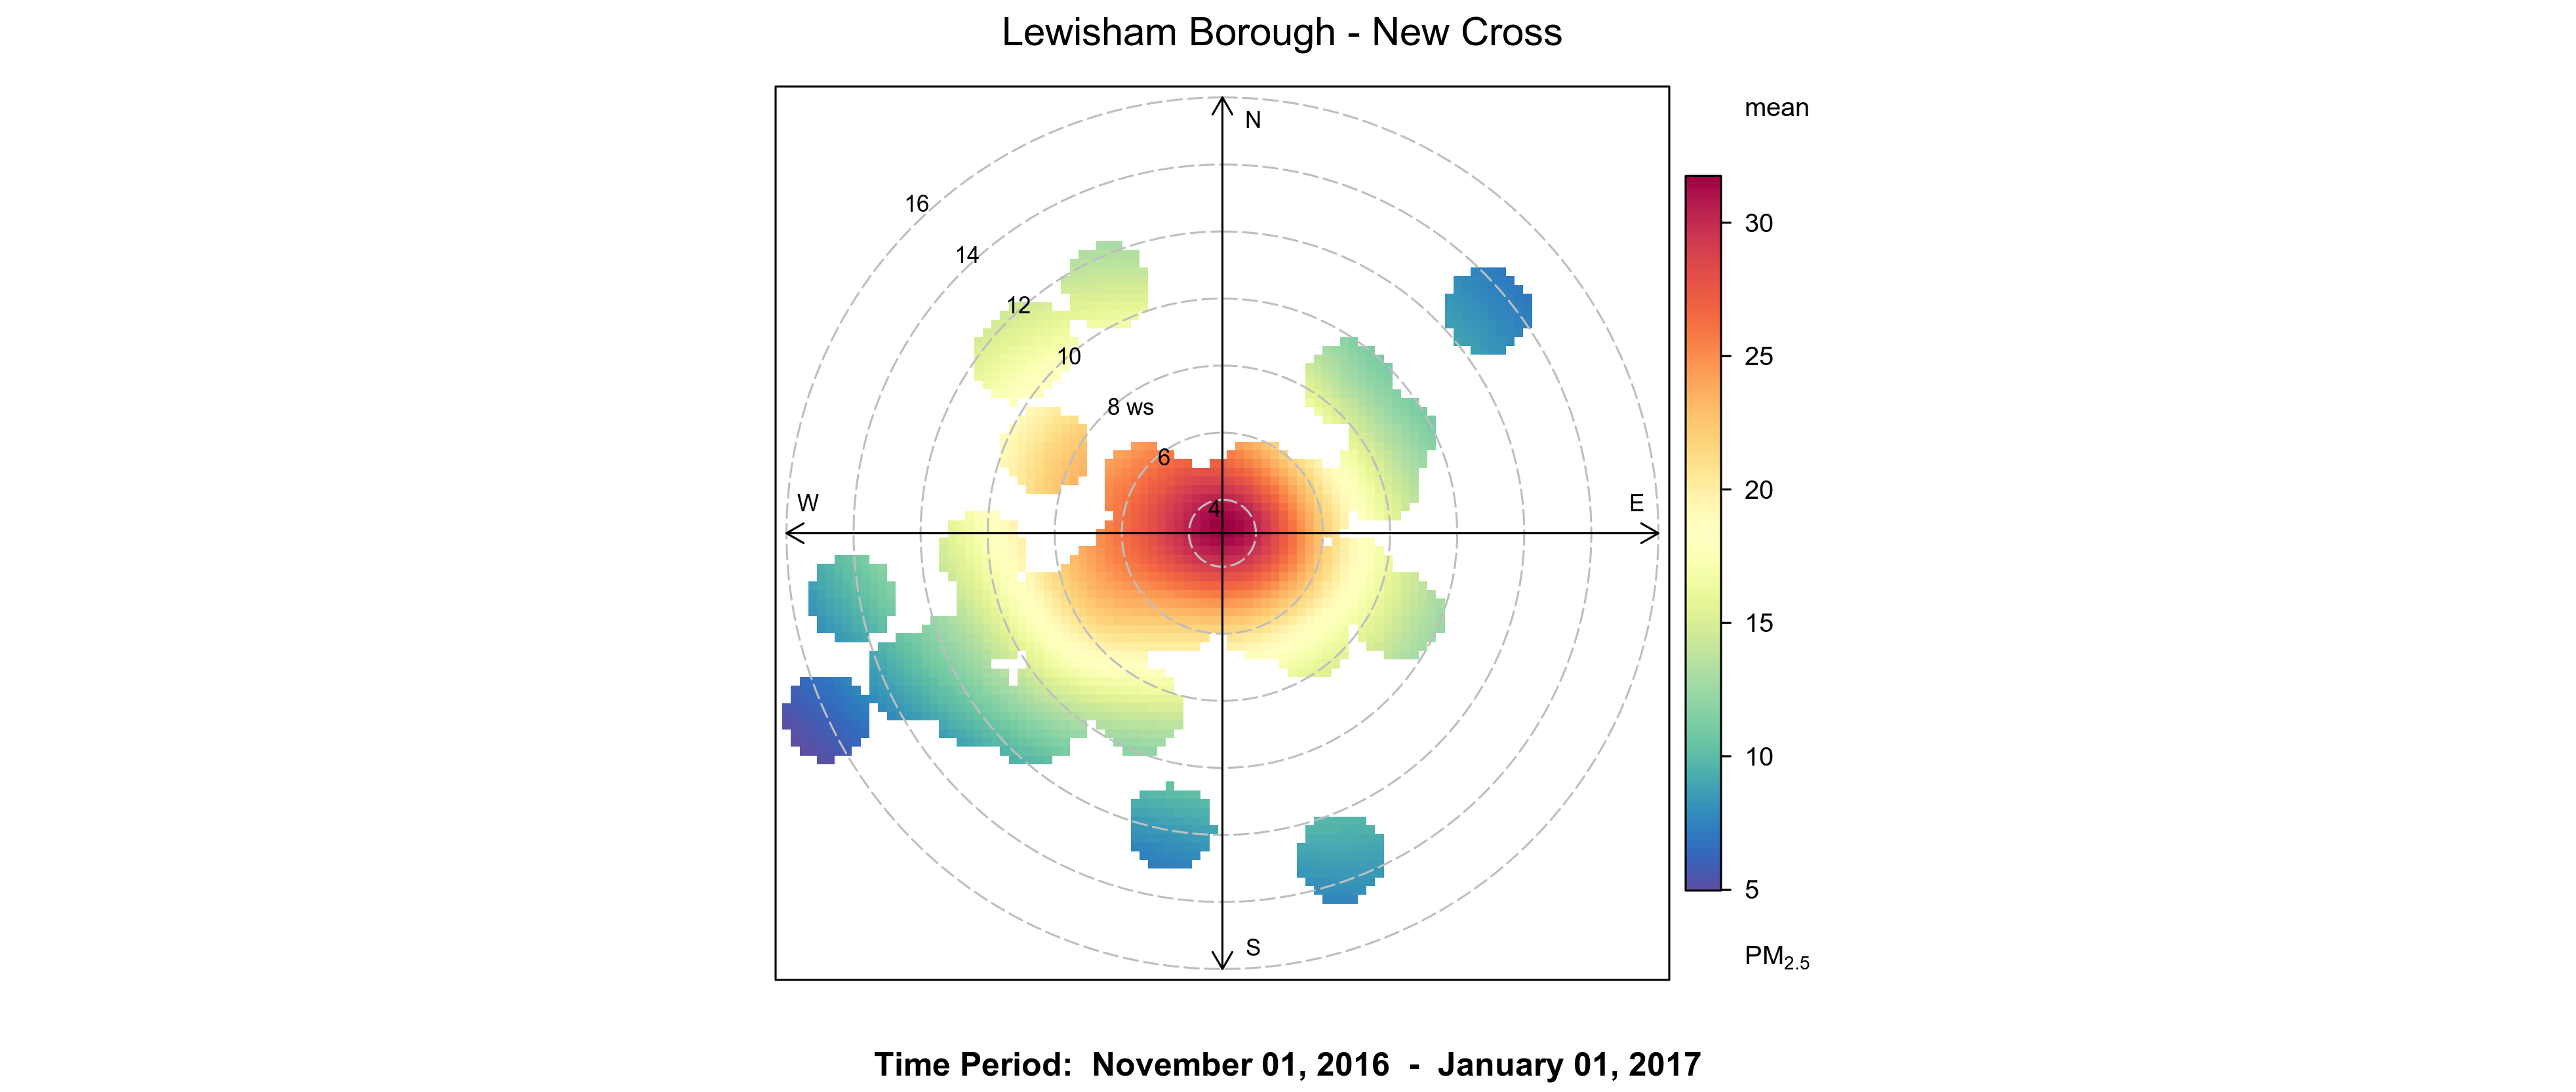
In these polar plots, colour contours reflect pollutant concentrations in relation to wind direction and wind speed. Calm conditions (zero wind) are shown in the centre, increasing to 20 metres per second (ms-1) at the outer ring. The highest mean concentrations are shown in red, the lowest are in blue.

Dustbox 108 is recording significantly high levels to the east during high winds of over 15 ms-1. These high levels could be somewhat amplified due to the calibration value applied, which could cause higher readings to appear more pronounced in comparison to the LAQN New Cross Gate monitoring station. Nevertheless, the PM2.5 levels at the Dustbox 108 location are relatively high in comparison to other monitoring sites for New Cross Gate and across the Citizen Sense monitoring network.
During moderate winds of 12.5 ms-1 and below, we see additional highs to the southeast and the north at the Dustbox 108 monitoring location.
Because the overall pollution levels at Dustbox 108 are relatively high, even patterns denoted by green and blue represent high levels of emissions. Dustbox 108 is recording high levels of emissions at the centre of the polar plot during low wind speeds of less than 5 ms-1. This may indicate a local source of pollution. Emissions are more pronounced on the eastern half of the plot (approximately 0O to 185O), potentially suggesting easterly sources. A purple spot in the west during low winds of 5 to 10 ms-1 suggests a source of cleaner air. Cleaner air at higher speeds of 15 ms-1 and beyond come from the west and northwest.
Dustbox 123 has the same high peaks to the east during high winds, which is reflected in many of the Dustboxes. At lower wind speeds of 12.5 ms-1 and below, Dustbox 123 shows high emissions predominantly from the northeast. In the centre of the plot where wind speeds are lowest, emissions levels are still high, pointing to local sources of pollution. The scaling of calibration values could also be a factor at this location.

If we exclude the London-wide pollution events in January and February 2017, we can see a clearer picture of the local sources at sites 108 and 128. Figure 10a shows a local source at the site of Dustbox 108 extending to the west and east. In Figure 10b, Dustbox 123 shows a pronounced source to the northeast.
The LAQN New Cross monitoring station shows similar patterns to Dustboxes 108 and 123. Peak readings were recorded when easterly winds blew at high rates of 15-20 ms-1. Cleaner air is recorded to the southwest during moderate and high winds of between 10 to 20 ms-1. The LAQN polar plot shows a pronounced circle of elevated pollution at low wind speeds of less than 5 ms-1, which suggests a local emissions source or sources, which in this case is likely to be New Cross Road.
Enlarge

Enlarge

Enlarge

As Dustbox 149 was not activated until March and had some breaks in data, Figure 12a shows a different date range, from 5 June to 1 August 2017.
Like the other Dustboxes, the highest pollution levels are registered to the east and northeast during moderate winds of 10 to 15 ms-1. Moderate pollution is recorded to the north and southeast at wind speeds of between 5-12 ms-1. The polar plot indicates that these are shared regional and city-wide sources of pollution.
The polar plot for Dustbox 149 shows low levels of local pollution overall. The lowest emissions (the cleanest air) are registered to the west, including at very low levels of wind. The site shows lower levels overall than the background monitoring LAQN station in Eltham, which is based in a leafy park. This could suggest that the pedestrianized location and enclosed garden-based green space of this site could have a significant mitigating effect on air quality in comparison to the other monitoring locations in New Cross Gate.
IV. Drawing the evidence together
Using the tools provided through the Citizen Sense Airsift Data Analysis Toolkit, we have characterized sources of particulate pollution detected in the New Cross Gate area as follows:
- While regional sources of pollution were detected, there was clear evidence of additional local source or sources at some locations, most likely related to road traffic, based on the analysis of line graphs and “spike” episodes above shared regional levels in London.
- The strongest local source(s) appear to be to the east, northeast and southeast of the Dustbox 108, 123 and 149 monitoring locations. New Cross Road (A2) is likely to be a significant source of local emissions. There is an indication at the Dustbox 149 location that green space and a set-back location on a pedestrian street can have a significant mitigating effect on pollution levels.
- The elevated levels of PM2.5 identified at Dustboxes 108 and 123 are strongest during the morning and evening, and the highest mean concentrations occurred on weekdays (although levels are high on weekends as well). These elevated levels are therefore likely to be related to commuter or general road traffic.
- Dustbox 149 generally has lower levels overall due to its secluded setting. However, hourly levels were higher during times of commuter traffic, and on Tuesdays and Thursdays, also suggesting that road traffic is a likely source. Queen’s Road and New Cross Road are possible emission sources at this location, although city-wide and regional pollutants are evident at this location.
- There are also common baseline patterns of pollution across these monitors, suggesting a range of sources that contribute to shared elevated PM2.5 levels across London from regional sources, especially from the east. Higher pollution levels from the east could indicate regional pollution gathered by easterly winds as they travel over continental Europe to reach the UK.
- It is clear that traffic has a considerable impact on elevated PM2.5 levels across the New Cross Gate monitoring locations. Local pollution episodes are likely to occur in relation to high levels of traffic. Additional local sources such as construction sites (including demolition, on-site equipment and wind-blown dust), and industry would add to and exacerbate elevated pollution levels. Levels at New Cross Gate are significantly higher than at other monitoring locations across the Citizen Sense study area, suggesting that transport (particularly major intersections) and other emissions sources are contributing to elevated levels in this location.
V. Actions
In relation to the evidence and findings from the Dustbox citizen monitoring study, preliminary actions are proposed here that take into account the neighbourhood context and existing community organisations and initiatives. The key areas for addressing air pollution include transport, construction, green infrastructure, and additional monitoring. These actions have been developed in consultation with monitoring participants and local area residents. Some actions are shared across the 7 data stories, while others are specific to this data story location:
Traffic and transport
- Building on the Lewisham Council Local Implementation Plan, develop a traffic management plan traffic for Deptford and New Cross in order to identify areas to improve pedestrian, cycle and public transport routes, and to understand the potential impact of the Ultra Low Emission Zone (ULEZ) on the area. Address the impact of new development and increasing population in the area, with a realistic projection of the likely numbers of new cars that will be in the area.
- Encourage the use of the River Thames as an alternative transport route for goods, construction and commuters and to reduce road traffic. However, require diesel-free or clean ship fuel to be used by vessels on the River Thames.
- Encourage and support transportation pilots to trial improved roadway design and circulation.
- Improve cycling opportunities in the area, and separate vehicle traffic from cycling traffic, including through the use of car-free green corridors.
- Post signs to encourage no idling. Signs that read ‘Turn your engine off’ and include images of people in pollution masks are more effective than text-only signs that read ‘No idling’.
- Encourage hybrid vehicles and busses, and investigate ways to integrate solar panels into the design of buses and bus stops. Allow for electric vehicle charging points to be requested by residents as part of community transport initiatives, and not only by those who own an electric vehicle.
Construction and development
- Ensure the fulfillment of Air Quality Impact Assessments (AQIAs), both at the planning and implementation stage of new developments, in order to accurately gauge the effect of construction with new developments. Develop adequate monitoring and compliance mechanisms for possible breaches of AQIAs.
- Develop planning and regulatory mechanisms for addressing the accumulative effects from construction and new developments. Impacts from construction and new development can include air pollution from demolition and siteworks, traffic during construction, and higher densities of buildings, people and traffic from new developments. Require that all new developments are ‘air quality neutral’, and ensure transparent and legible processes are in place for ensuring neutrality.
- Join up traffic planning across existing and new developments to facilitate walking, cycling and public transport. Design for neighbourliness with pedestrianized and play streets.
- Encourage cross-borough collaboration on construction and new development. Pending developments at the edge of Deptford, including the Silvertown Tunnel, the Enderby Wharf cruise ferry terminal, the Knight Dragon development at North Greenwich peninsula, and the Royal Docks Enterprise Zone could have a considerable effect on traffic in the area, especially along Evelyn Street.
- Include plans for managing construction traffic as part of providing planning approval for new developments. Ensure that construction traffic does not exceed set levels so as to avoid additional local pollution events.
- Address and prevent the loss of green space and public space due to new development. Green spaces can have a significant mitigating effect on air quality, and also provide a lower emission space in which people can spend time outdoors.
- Provide indicators for how to measure the effectiveness of dust measurement plans and practices at construction sites. Working with the London Low Emission Construction Partnership, provide mechanisms for enforcing dust management plans when they are not adhered to, and for reporting violations.
Green infrastructure
- Require an audit of green spaces in the borough, including an assessment of the suitability of green space as green infrastructure in relation to air pollution mitigation, and in relation to improving walkability and cycleability. Using existing London tree mapping resources, develop a tree plan for planting in the borough, and in relation to best guidance for trees suitable for minimising and lowering air pollution.
- Plant trees and preserve green spaces in relation to air quality guidance for vegetation.
- Investigate opportunities for planting air quality enhancing vegetation in existing neighbourhood green spaces, as well as at schools, hospitals, playgrounds and key community sites.
- Link with groups such as the New Cross Gate Trust to identify opportunities for improving the local environment.
- Provide guidance on planting for air quality, including preferred species, optimal planting arrangements, and best practices for maintenance.
- Host air pollution monitoring and awareness events in green spaces to raise awareness about the importance of urban design and planning in relation to mitigating and prevent air pollution.
Air quality monitoring
- Prioritise air-quality audits of emission levels at Deptford and New Cross schools, in line with the Mayor of London’s initiative. Expand and provide courses in schools for children to learn about air quality and to undertake air quality monitoring in their local area, including promoting actions for reducing air pollution such as walking to school.
- Provide resources for community organisations and residents to continue to monitor air quality over time in order to assess improvements from preventative and mitigating actions.
- Provide resources to undertake speciation to understand the composition and sources of particulate matter, including from roads, construction and other sources.
- Develop protocols and channels for citizens to provide monitoring data to local and GLA environmental health and planning officers, and require officers to act on identified exceedances in relation to air quality guidelines.
Acknowledgements
The Citizen Sense project is led by Professor Jennifer Gabrys. These data stories were developed working in collaboration with Helen Pritchard and Dr Lara Houston. Thanks are due to our collaborators including:
Dr Benjamin Barratt and Khadija Jabeen at the Environmental Research Group, King’s College, University of London contributed to co-location and calibration of the Dustboxes, and Dr Barratt contributed to the analysis of the data stories.
Lau Thiam Kok contributed to the co-development of the Citizen Sense Airsift Data Analysis Toolkits, using and adapting openair software developed by Dr David Carslaw.
Raphael Faeh contributed to the digital design and layout of the “Pollution Sensing” data stories, which provided a model for these “Urban Sensing” data stories.
The Citizen Sense Dustbox included contributions to the printed circuit board design, which was developed in collaboration with Adrian McEwen of MCQN Ltd, and to the ceramic housing, which was rendered into 3D-printable format in collaboration with materials designer Francesca Perona.
Special thanks are due to the participants and residents in southeast London who contributed to the development and testing of the Dustbox monitoring kit, as well as to the collection and analysis of data, and communication of results to wider publics and regulators. For more information on project contributors, see Citizen Sense People.
These data stories are generated using the Citizen Sense Airsift Data Analysis Toolkit, which was developed to allow for citizen-led interpretation of datasets. The core data available for interpretation is the Dustbox PM2.5 sensor data. The Airsift toolkit also brings in air quality data from select sites in the London Air Quality Network (LAQN) for comparison with the citizen data.
In order to blur the exact monitoring locations, the monitoring locations are shown with large blue circles to indicate the approximate monitoring location. Additional citizen monitoring locations are anonymous, and are not included on the Airsift map.
At the start of the monitoring period, the Dustboxes were co-located with the Marylebone Atmospheric Observatory, and a scaling factor was applied to calibrate the devices. Because the sensors were co-located and calibrated during a time of low to moderate pollution, the scaling factor could slightly amplify higher readings in relation to the LAQN readings. However, this would require further testing to demonstrate, since when comparing Dustbox levels with nearby LAQN levels (where available), readings are often comparable.
This data story is prepared under the assumption that all pollutant, cartographic and meteorological measurements are valid and not sufficiently biased to cause misrepresentation of results. Please refer to the Airsift Data Analysis Toolkits and Terms of Use for further information.
The research leading to these results has received funding from the European Research Council under the European Union’s Seventh Framework Programme (FP/2007-2013) / ERC Grant Agreement n. 313347, “Citizen Sensing and Environmental Practice: Assessing Participatory Engagements with Environments through Sensor Technologies.
To cite this data story, please use the reference: Citizen Sense (2017) “New Cross Gate,” Deptford Data Stories, 14 November. Available at: https://datastories-deptford.citizensense.net/new-cross-gate.
This New Cross Gate data story is also available to download as a PDF.