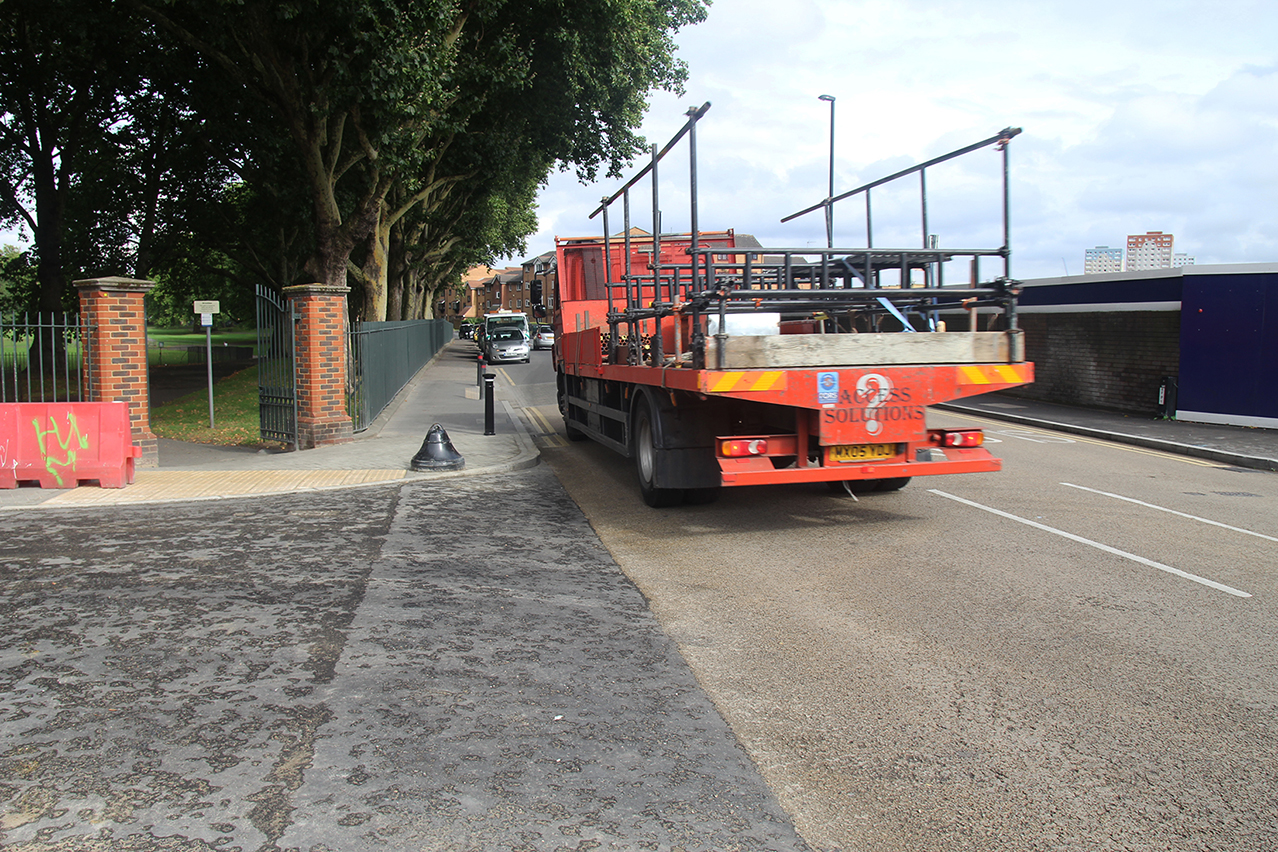
The key findings from citizen monitoring in the Deptford Park area indicate that automobile and HGV traffic are primary sources of emissions. These emission levels are most likely made worse by extensive construction activity and construction-related traffic in the area. This is especially evident in relation to Evelyn Street and Grinstead Road.
This data story details below how citizen data, weather data and local observations reveal these specific pollution patterns. Drawing on workshops with local residents, the data story also suggests how best to address the problem, from planning for better transport to improving green infrastructure in the area.
I. The Location
The Deptford Park monitoring area includes a wide range of land uses, from residences and schools to heavy industry, including a waste transfer yard and Southeast Combined Heat and Power (SELCHP) incinerator to the west of the monitoring location.
There are two parks in this location, Deptford Park and Folkestone Gardens, which are key amenities for the area. Deptford Park, which was formerly a market garden, was sold by the Evelyn family to the London County Council and first opened to the public as a park in 1897. At 7.07 hectares it is one of the largest green spaces in the locality. It is comprised of a large grassy area with mature trees on all four borders, as well as a football pitch, seating areas and a playground.
This part of the borough is undergoing rapid changes in land use, as large brownfield sites have been acquired by developers for the construction of high-density housing and a range of mixed-use amenities. Some of these projects remain in design and planning stages, but there are several active construction projects currently underway or nearing completion, including Anthology residential developments. Construction traffic occurs as a result of the ongoing developments in the area.
In total, 30 monitors were distributed to participants. The monitoring period ran for over 9 months, until September 2017. During peak monitoring activity, there were 21 active Dustboxes.
Local sources of particulate pollution
This data story compares a number of citizen monitoring sites nearby Deptford Park. Dustboxes 105 and 131 are situated in the back gardens of terraced houses on residential streets adjacent to the park. Dustbox 104 is also in the back garden of a house in a similar residential area but further south of the park. There are two anonymous monitoring locations in this area that are not included on the map. Anonymous data is used to corroborate findings in this data story, however, the anonymous Dustboxes are not included as named individual monitors. Dustboxes 104 and 105 monitored intermittently, due to the use of battery packs.
As the map below shows, transportation corridors are the most immediately visible sources of particulate pollution. Evelyn Street (A200) runs parallel to the eastern boundary of Deptford Park, at a distance of approximately 50 metres. Evelyn Street meets a major one-way system to the northwest of the park (approximately 300 metres from the park’s northern boundary at the junction of Evelyn Street and Bestwood Street). The smaller residential streets of Scawen Road and Grinstead Road encircle the park on the other three sides to the north, west and south at a distance of approximately 5 metres. Further west of the park lies Trundley’s Road (B207), which runs roughly parallel to the park’s western boundary at a distance of between 65 metres and 90 metres. Trundley’s Road connects up to Bush Road, the northern arm of the one-way system. This area is also home to significant rail infrastructure for electric trains to the west and south of the park, which is used by Southeastern and Southern rail services and the TFL Overground service.
Monitoring and emissions near Deptford Park
To the west and southwest of Deptford Park is a cluster of businesses involved in waste management, shown in the map above. SELCHP is a combined heat and power facility that incinerates waste. The by-products include a range of gaseous species that include nitrogen oxides and ammonia, which are precursors to secondary particulate matter. Emissions are released via a 100-metre chimney stack. The processing of waste at the CD waste transfer yard and the Lewisham Reuse and Recycling Centre is another possible source of particulate matter. The waste transfer yard has been of previous concern to residents, and measures were implemented to attempt to reduce dust levels through various dust suppressant strategies. There was previously a London Air Quality Network (LAQN) monitor on Mercury Way that monitored for PM10, but this monitor is now meant to be managed by the Environment Agency, although the current data for this site does not appear to be available online. There are numerous busy roads with traffic from HGVs serving the incinerator with rubbish (most frequently from the Borough of Westminster) and hauling debris to and from the waste transfer yard. There is also a petrol station that is the site of frequent truck and car traffic on and off Evelyn Street at Oxestalls Road.
Enlarge

Other businesses in the area include skip hire, site clearance and roofing services, which could produce particulate matter in the form of dust. These activities also entail regular movements of HGVs. The Anthology residential development was under construction across the monitoring period, and the site continues to be served by heavy truck traffic. During the spring and summer months soil decontamination works were underway at the Neptune Wharf site on Grinstead Road, which was a former chemical works site. At the time that this monitoring network was coming to an end, groundworks for the Timberyard development were in preparation.
Enlarge
London-wide, regional and global sources of particulate pollution
Particulate matter sources in London can be attributed to a broad range of emissions. Within London, PM2.5 from transport (particularly diesel), industry, construction, cooking and heating all contribute significantly to London-wide levels. A significant amount of PM2.5 emissions also comes from heavy industry and agriculture outside the UK, particularly France, Belgium, the Netherlands, Luxembourg, Germany and Poland. These emissions are thought to account for an urban background of approximately 10 µg/m3. The importance of these transboundary effects of PM2.5 emissions from outside of the UK on the total London PM2.5 can vary between 40% to 80% daily depending on weather conditions. When long-range pollution episodes do occur in London, they are generally carried on easterly winds. There are a number of global emissions, events and practices that contribute particulate matter to the total London PM2.5, including fuel production, industrial and domestic combustion, transportation, waste disposal, and agriculture, although these are harder to quantify.
Observations
Residents have been in dialogue with local authorities over episodes of poor air quality, especially in relation to the recurrence of strong unpleasant smells from the local waste transfer yard. Residents have also experienced episodes of strong chemical smells, such as the intense smell of pineapple, which they attribute to odour control spraying in this facility. Residents are concerned about the impact of emissions from SELCHP on local air quality, and reported that emissions were vented continuously, although the plume was most visible early in the morning. Residents experience poor air quality travelling along Evelyn Street, and note that the location of a local primary school directly on the highway is of concern. Residents reported that the decontamination works that took place during April, May, and June 2017 at the Neptune Wharf site on Grinstead Road gave off a strong burning smell, and frequent calls were made to the fire brigade. At times, water sprayers were visible on site, which were used to dampen down exposed soils. Contaminated soils were reportedly moved off-site for remediation. Re-suspension of particulates could have been possible on Grinstead Road during the groundworks. Residents also reported that construction dust was visible on the roadways near the Timberyard development site, which could be another possible particulate source.
II. Is there evidence of a problem?
The Dustbox device used to monitor PM2.5 is an “indicative” monitor. This means that measurements can give an indication of pollutant concentrations, but cannot be directly compared with national and international guidelines and standards in an “official” or regulatory sense. Despite this, indicative monitors are a well-established method within atmospheric science for carrying out initial surveys of an area to establish whether a potential problem merits further investigation. Indicative monitors are also becoming increasingly available for citizen-based air-quality monitoring, similar to this study.
Where possible, the Dustboxes were co-located at the start and the end of the study to account for differences in the sensors and drift during the monitoring period. The co-location of Dustboxes in this data story indicates that there is a good similarity in measurements across the monitors used in this monitoring location, as well as with monitors in the extended community network, both at the start and end of the monitoring period.
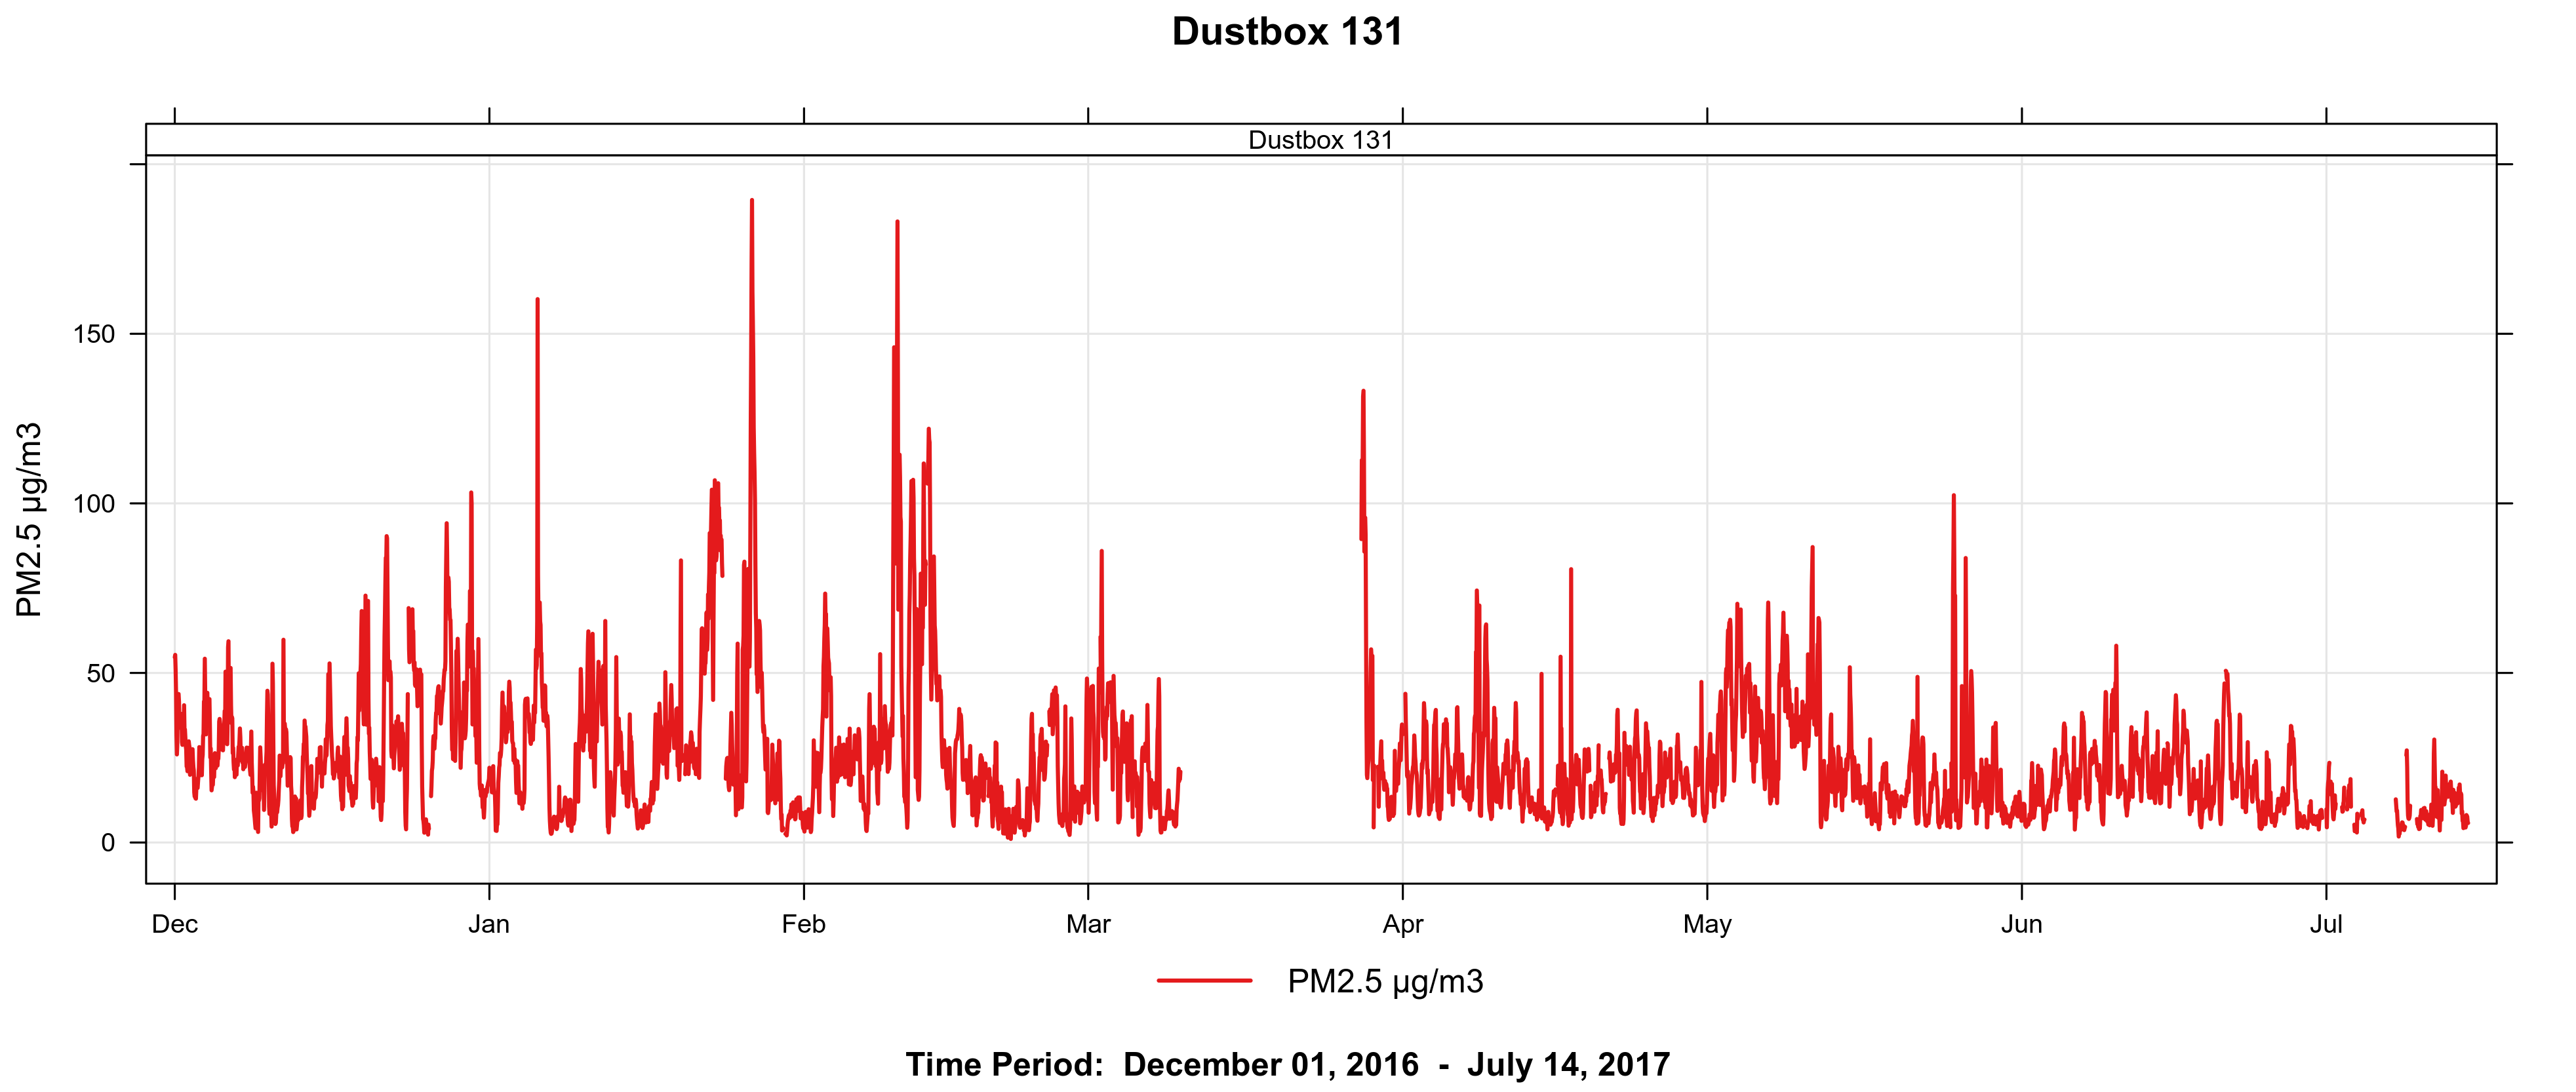
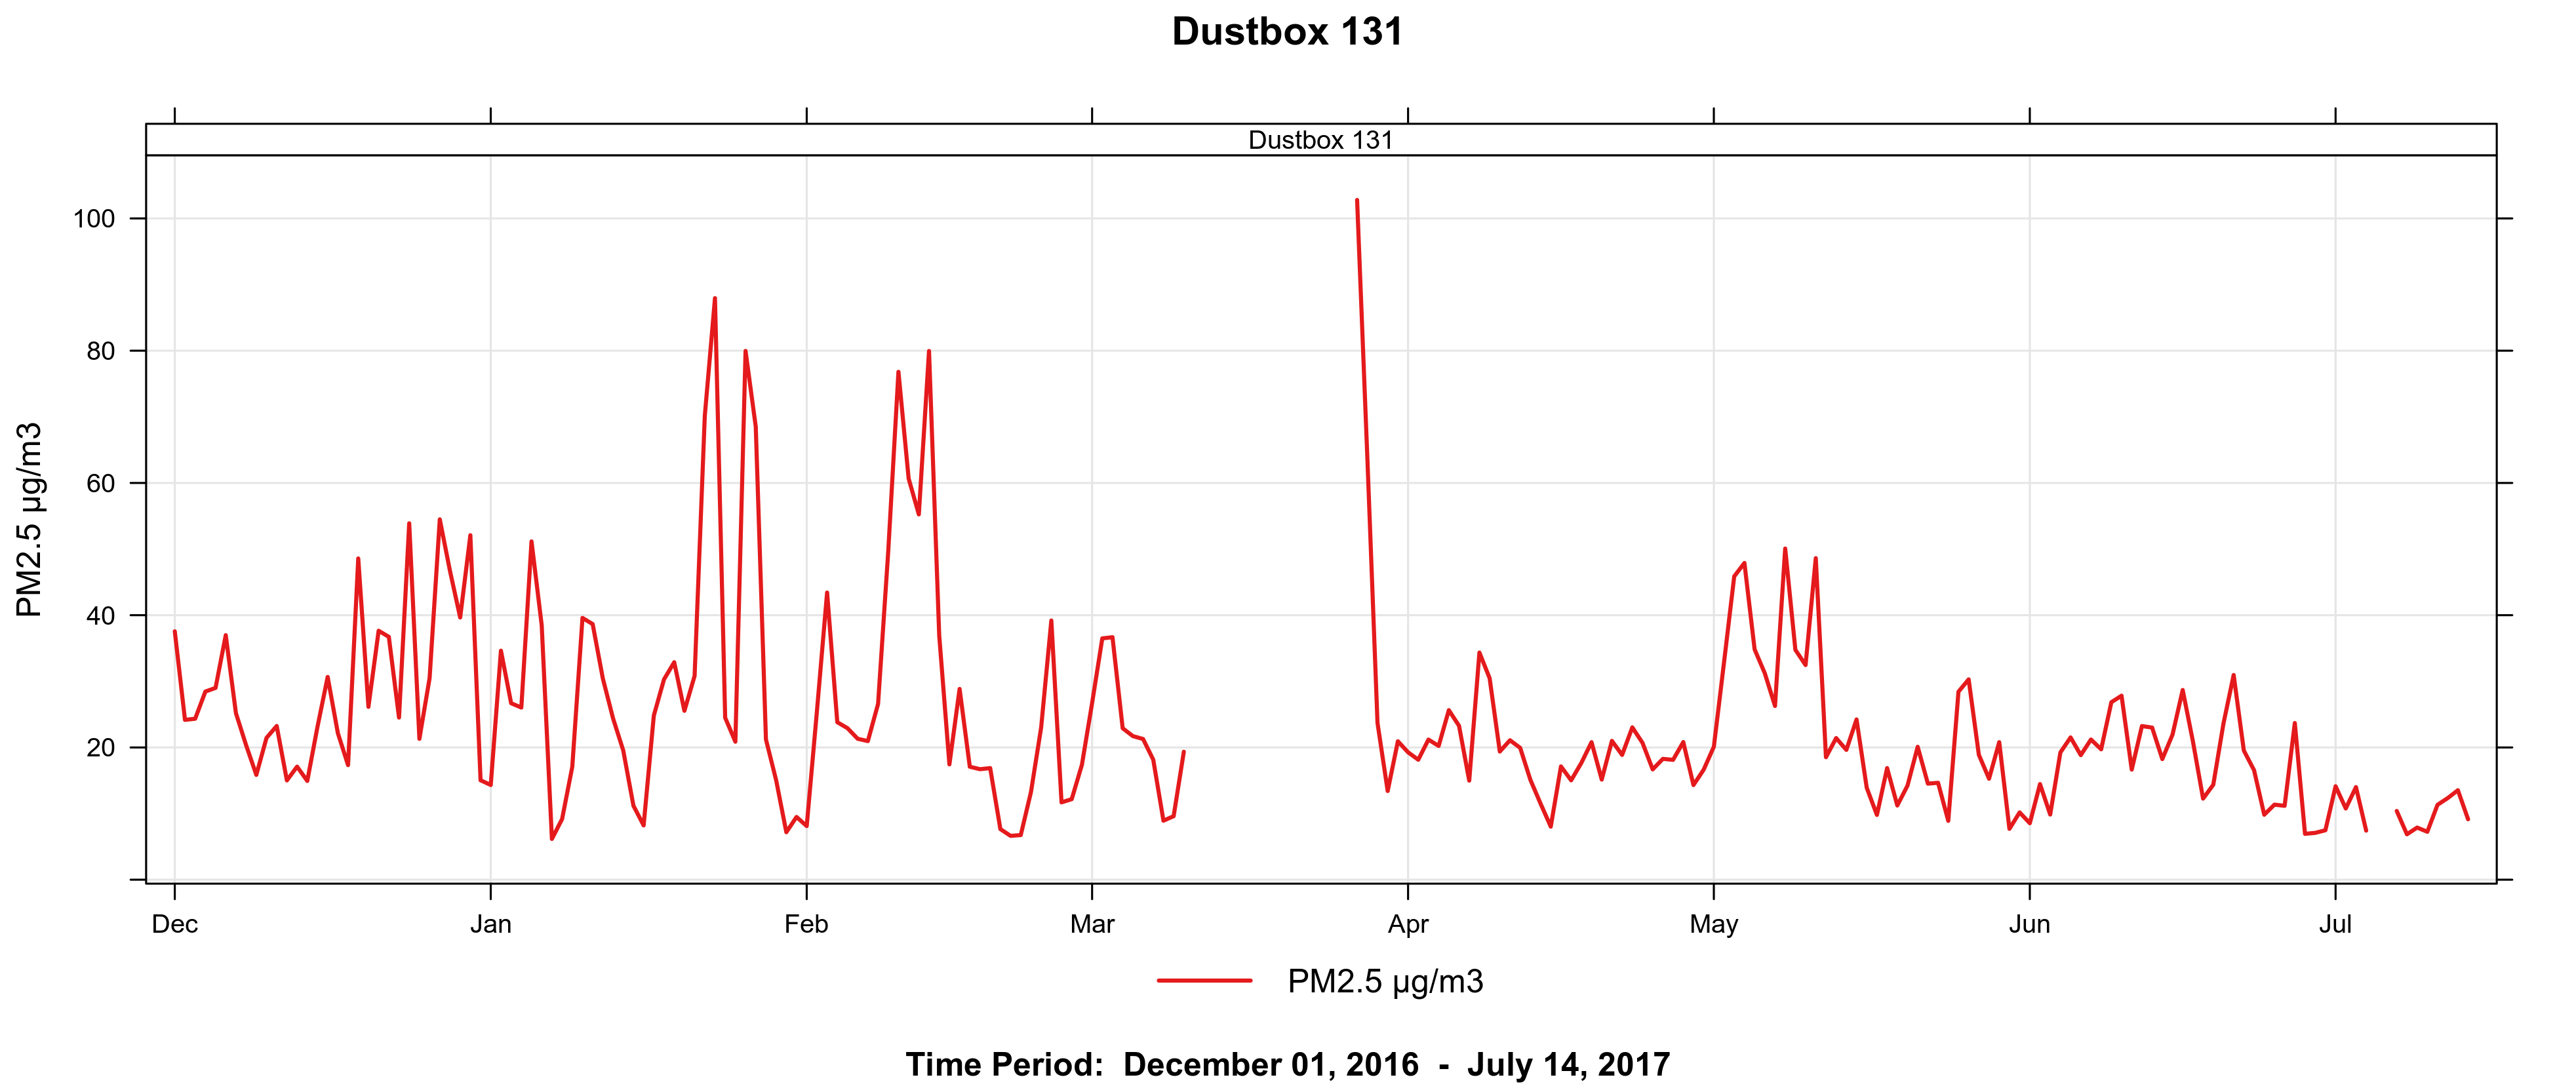
The World Health Organisation (WHO) has established a 24-hour mean guideline for PM2.5 of 25 µg/m3 (although there is no safe level of exposure). The time series graphs above in Figures 1 and 2 show that the WHO guideline of 25 µg/m3 for the 24-hour daily mean concentration of PM2.5 was regularly breached between December 2016 and June 2017.
The WHO annual mean guideline for PM2.5 is 10 µg/m3, and recent reports indicate that 95% of London exceeds this guideline, often by nearly double, on an annual basis.


It is important to determine whether these exceedances were caused by “local” sources of pollution close to the sensor (i.e., within 300 metres), or by regional sources affecting the wider area. By comparing the Deptford Park monitors to Dustbox 118 (Figure 3 above) and to the LAQN New Cross monitoring station (Figure 4 above), we can see that while many spikes are borough-wide pollution events, there are also more local events indicated by spikes on top of humps, for example at the beginning of March 2017.
There are many possible sources of pollution in the area, and we have to look at the measurements more closely to see if we can deduce which activities are causing these spikes. Knowing the source of pollution is important as some activities produce more toxic particulate matter than others, and actions to mitigate sources should be targeted to the cause of the problem.
III. Characterizing the problem
When is the source most evident?
Using time plots, it is possible to analyse the times when pollution levels are most frequently elevated. Time plots aggregate PM2.5 concentrations according to time, so that key patterns such as rush hours and traffic, as well as possible construction or industry sources, along with regional pollution events due to seasonal variation, are evident.
We are interested in ascertaining local sources of pollution in the vicinity of Dustboxes 104, 105 and 131 according to temporal patterns. The figures below group particulate concentrations across the monitoring period by hour, day of the week and month.
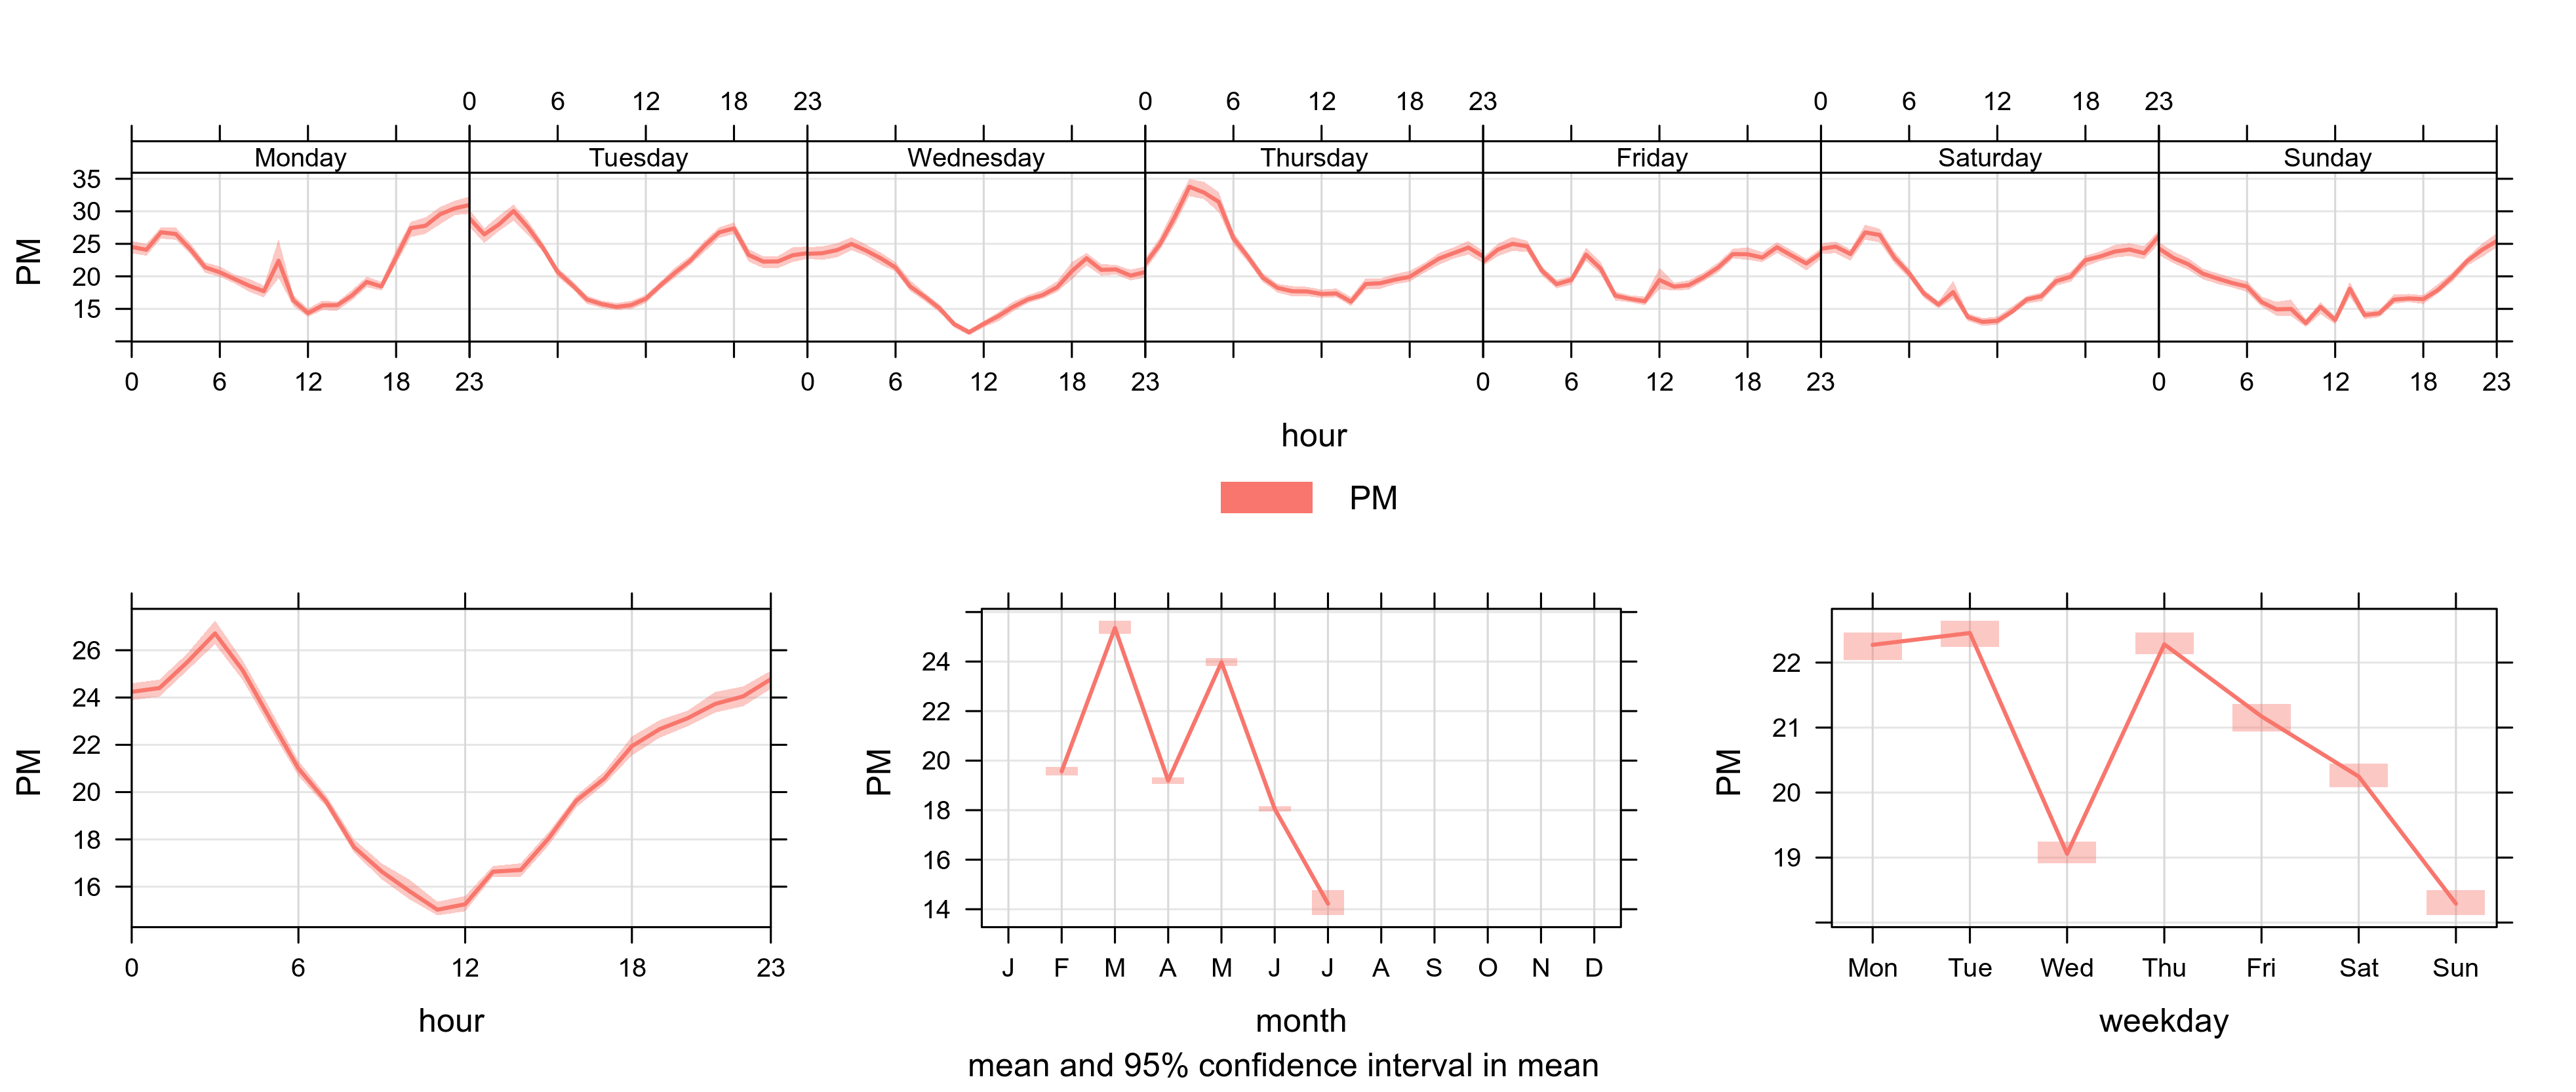
In London, transportation networks are known to be a significant source of PM2.5 emissions. If local roads were important sources of pollution at the Dustbox monitoring locations, we would expect to see a diurnal pattern where levels of particulates were lower at night and higher during the daytime, with peak levels coinciding with morning and evening commutes. In Figure 5 referring to Dustbox 131, we see an early morning peak and an early evening peak. However, the lowest levels of particulates are actually during the late morning, rather than at night as expected. Readings remain elevated overnight, a phenomenon that merits further investigation.
In a general sense, it should be noted that the weather plays a significant role in particulate levels. For example, dust tends to be dispersed more slowly during the hours of darkness, as vertical and horizontal wind speeds are generally lower. This phenomenon may skew charts somewhat.
Which direction is PM2.5 coming from?
Particulates are carried by the wind from emissions sources to the monitoring area. The direction and speed of wind are therefore important ways to gauge the locations of emissions sources in relation to the Dustbox monitors.
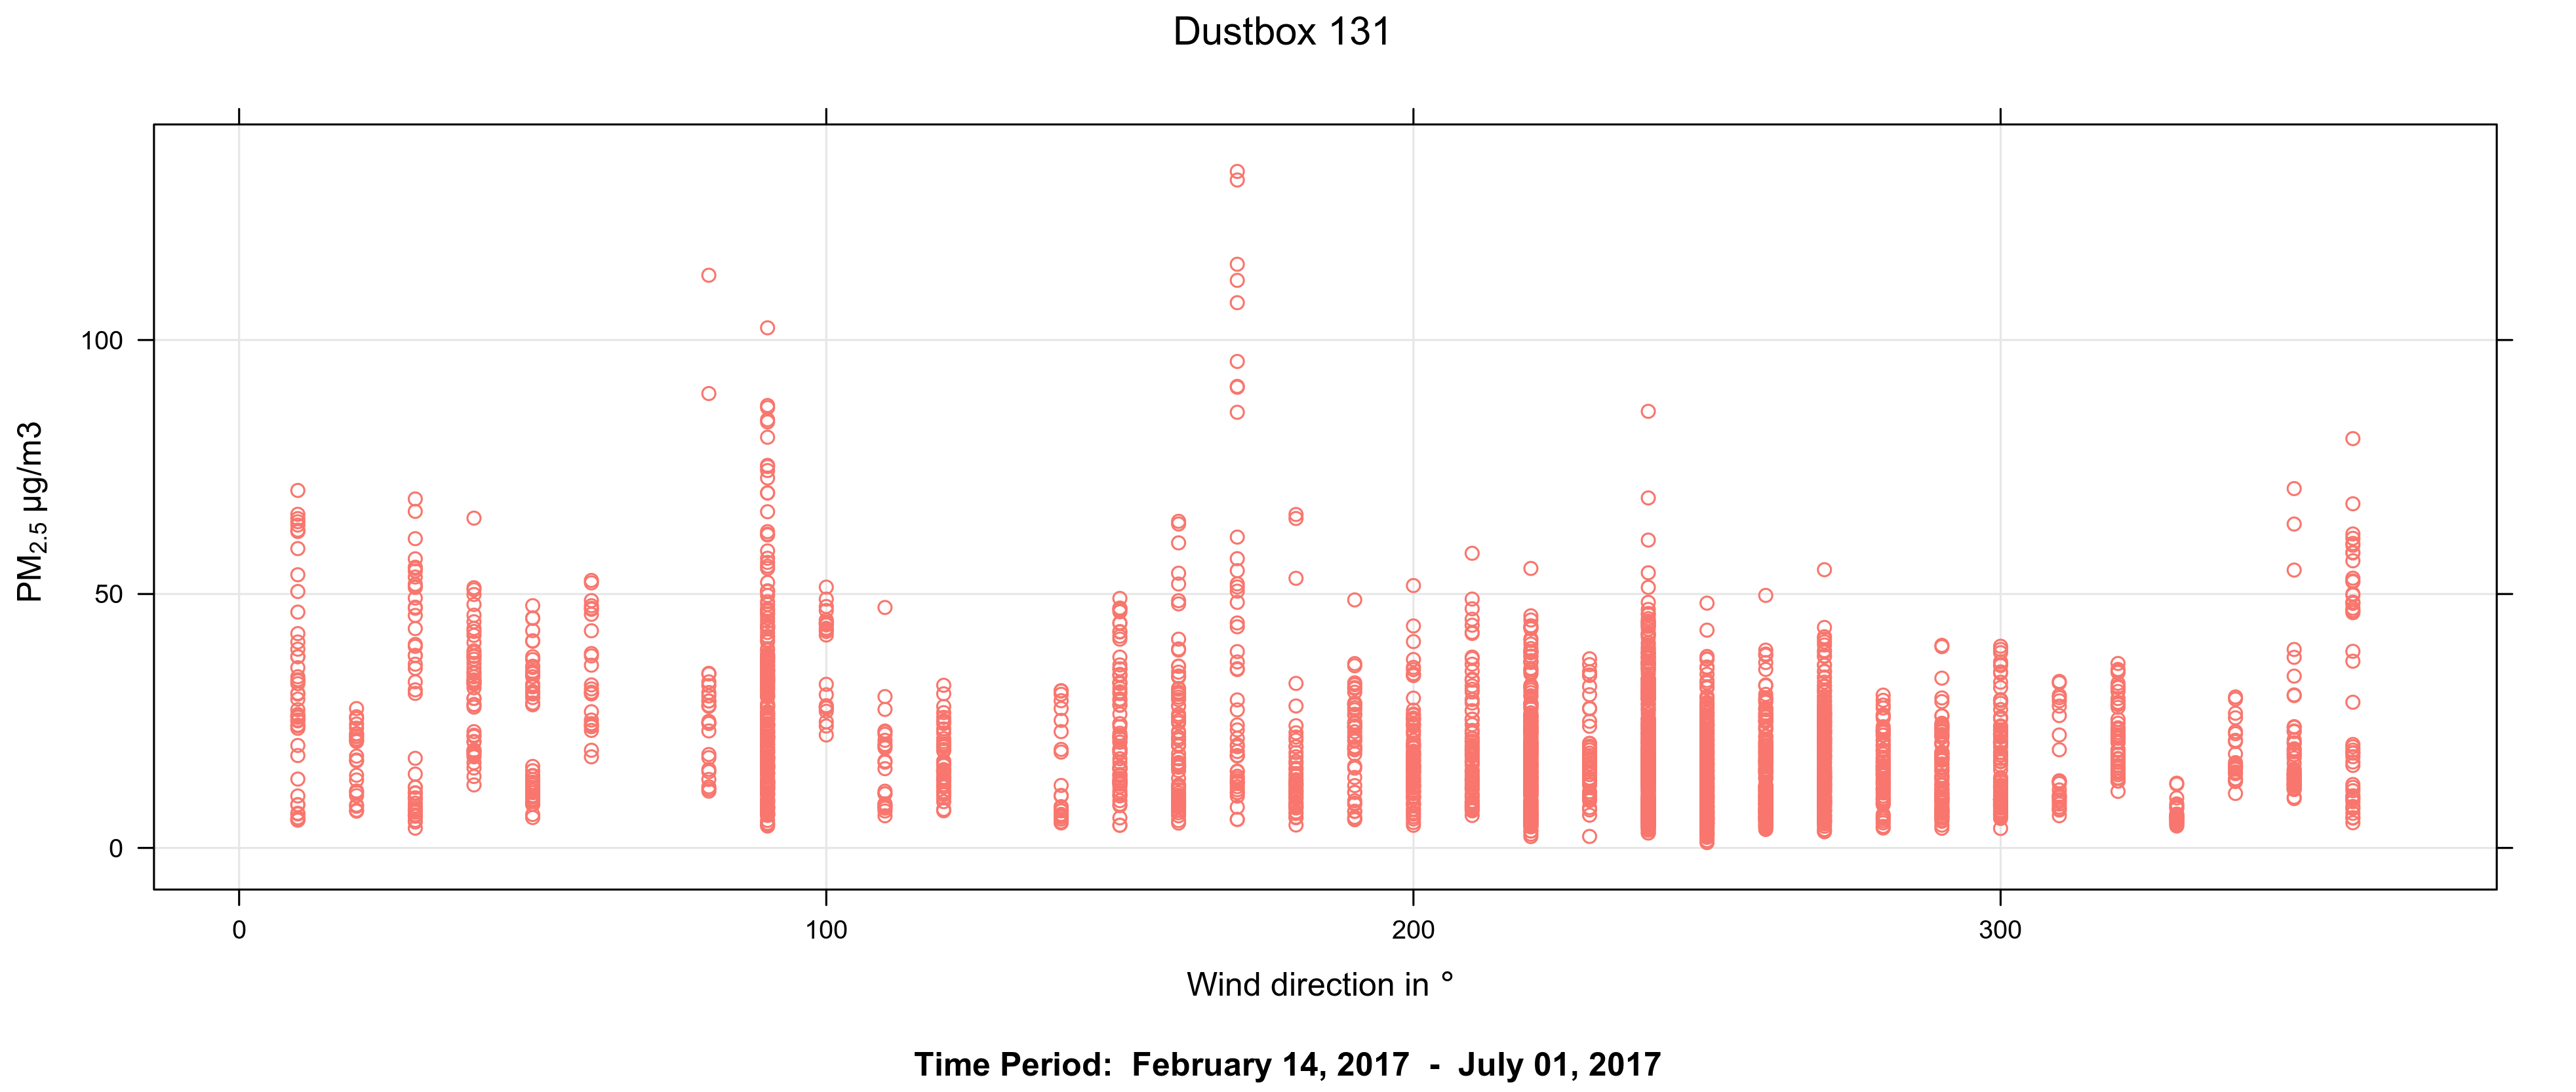
In Figure 6, the scatter plot shows that elevated levels of pollution are recorded when the wind is blowing from the northeast to east (60O to 90O). However, the scatter plot also shows PM2.5 at higher levels when the wind is blowing from the south (180O) and southwest (240O).
The following polar plots also illustrate this relationship. Colour contours reflect pollutant concentrations in relation to wind direction and wind speed. Calm conditions (zero wind) are shown in the centre, increasing up to 20 metres per second (ms-1) at the outer ring. The highest mean concentrations are shown in red, the lowest are in blue.
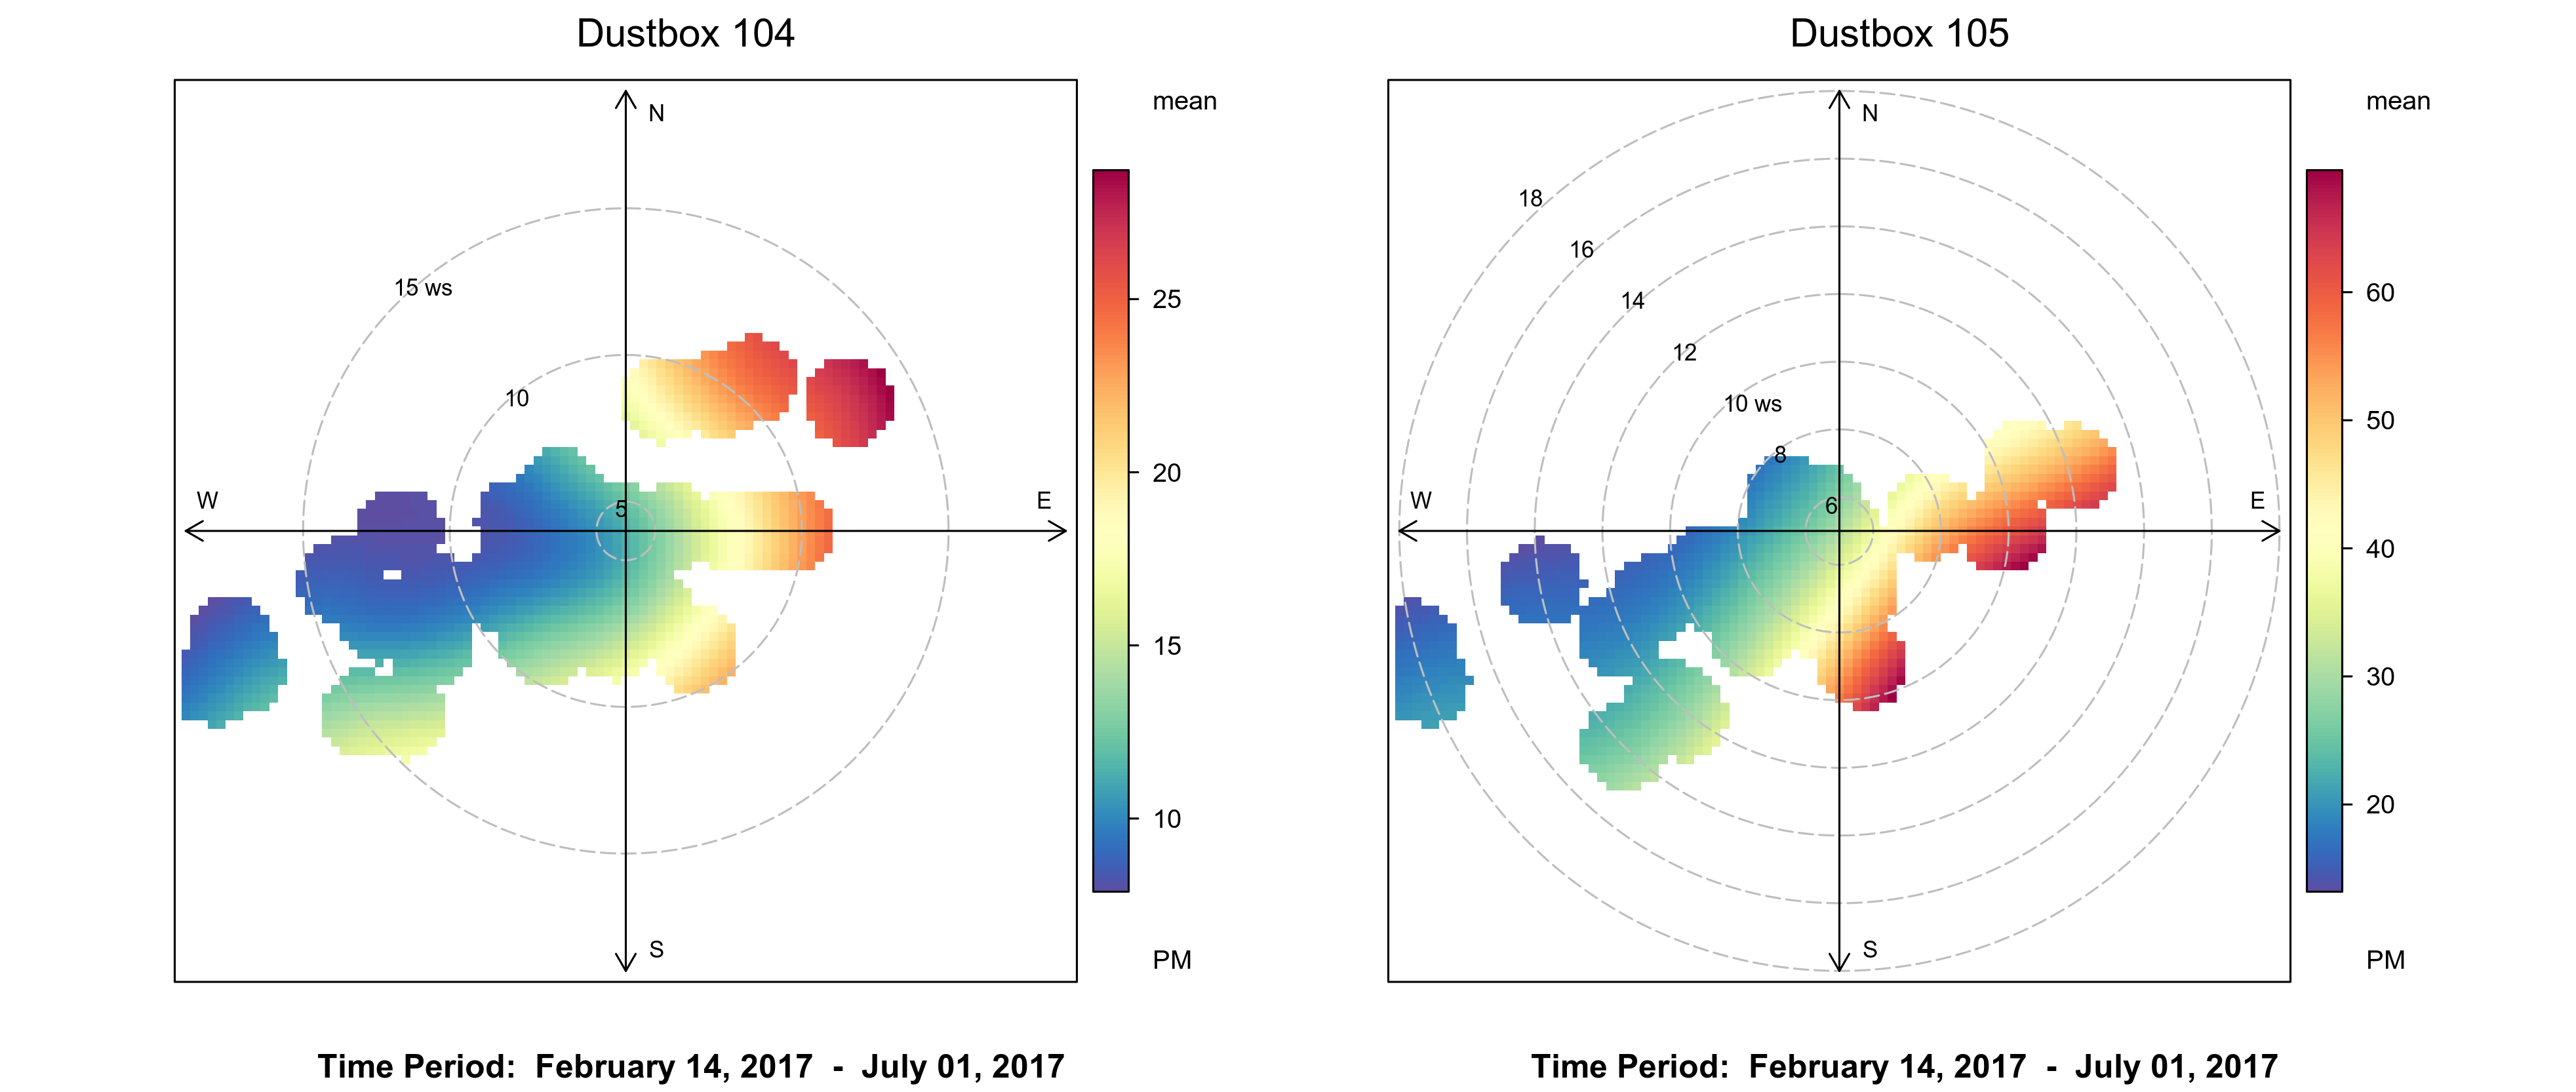
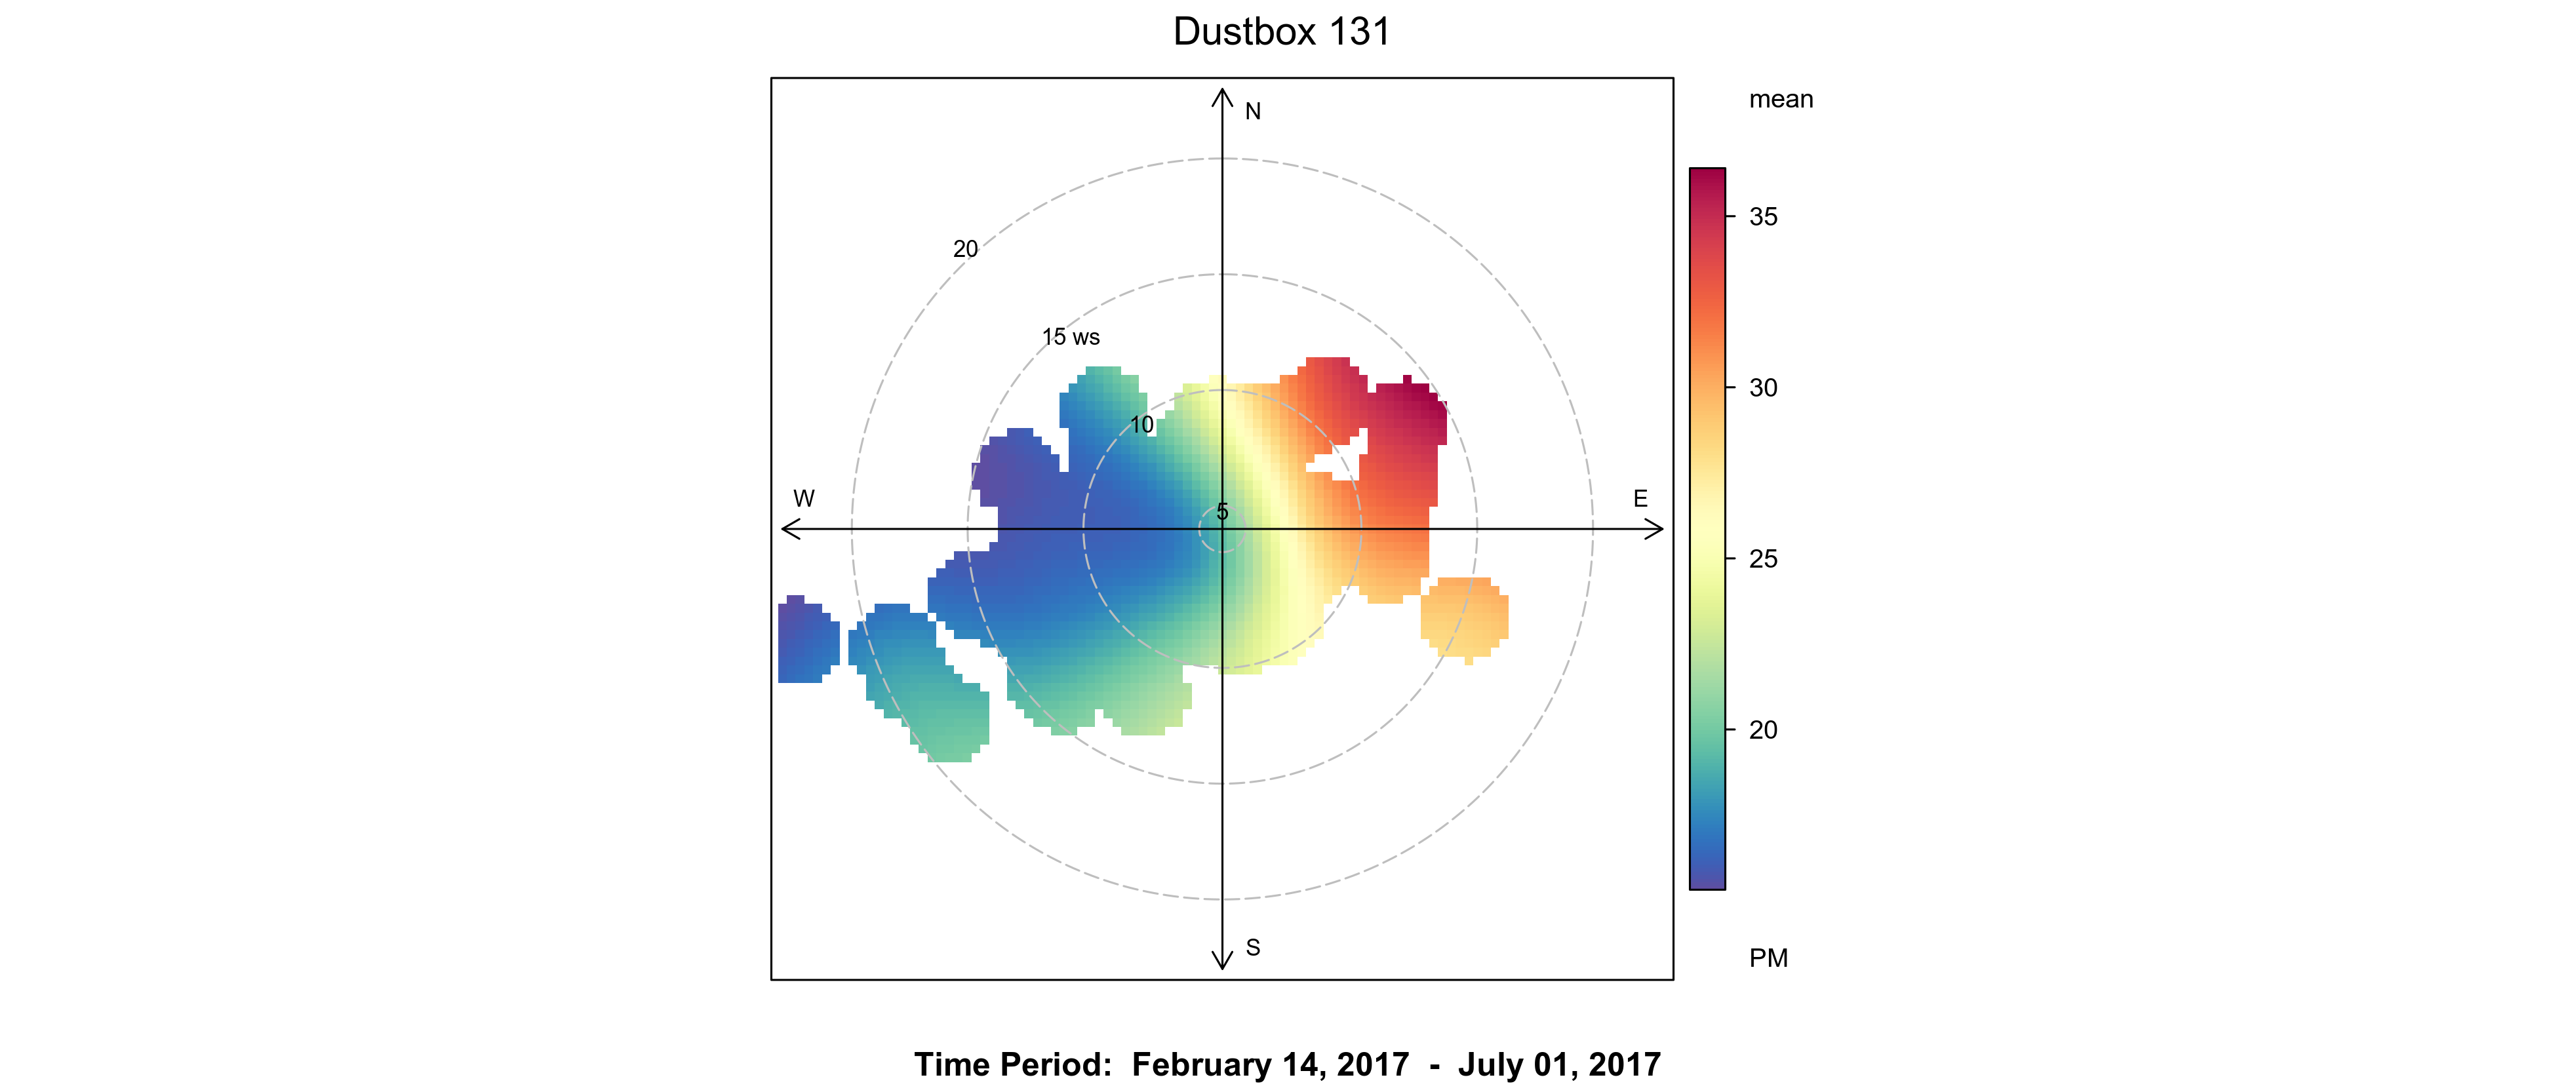

The above polar plots for Dustboxes 104, 105 and 131 all show a similar pattern that corresponds with the scatter plot in Figure 6, which indicates that high levels of PM2.5 are recorded from the northeast, east and southeast at low to moderate wind speeds.
Figure 9 for the LAQN New Cross monitoring station also shows high levels to the east, and northeast. There could be London-wide sources to the northeast and east that are recorded by all four Dustboxes in the area. This matches with the other Dustbox data stories in different parts of Deptford and New Cross. At the same time, the polar plots for Dustboxes 104 and 105 suggest that there could be a particulate source between the two monitors, as Dustbox 104 shows a source from the northeast and north, while Dustbox 105 shows a source from the southeast. Grinstead Road and Evelyn Street, as well as the construction in these areas, are possible sources of emissions at these sites.
Under which weather conditions are PM2.5 levels most evident?
Different sources of pollution will act in distinct ways according to the weather. For example, windblown dust will primarily occur during dry, windy conditions. Sometimes, you can learn about a source by characterizing this weather-related behaviour.
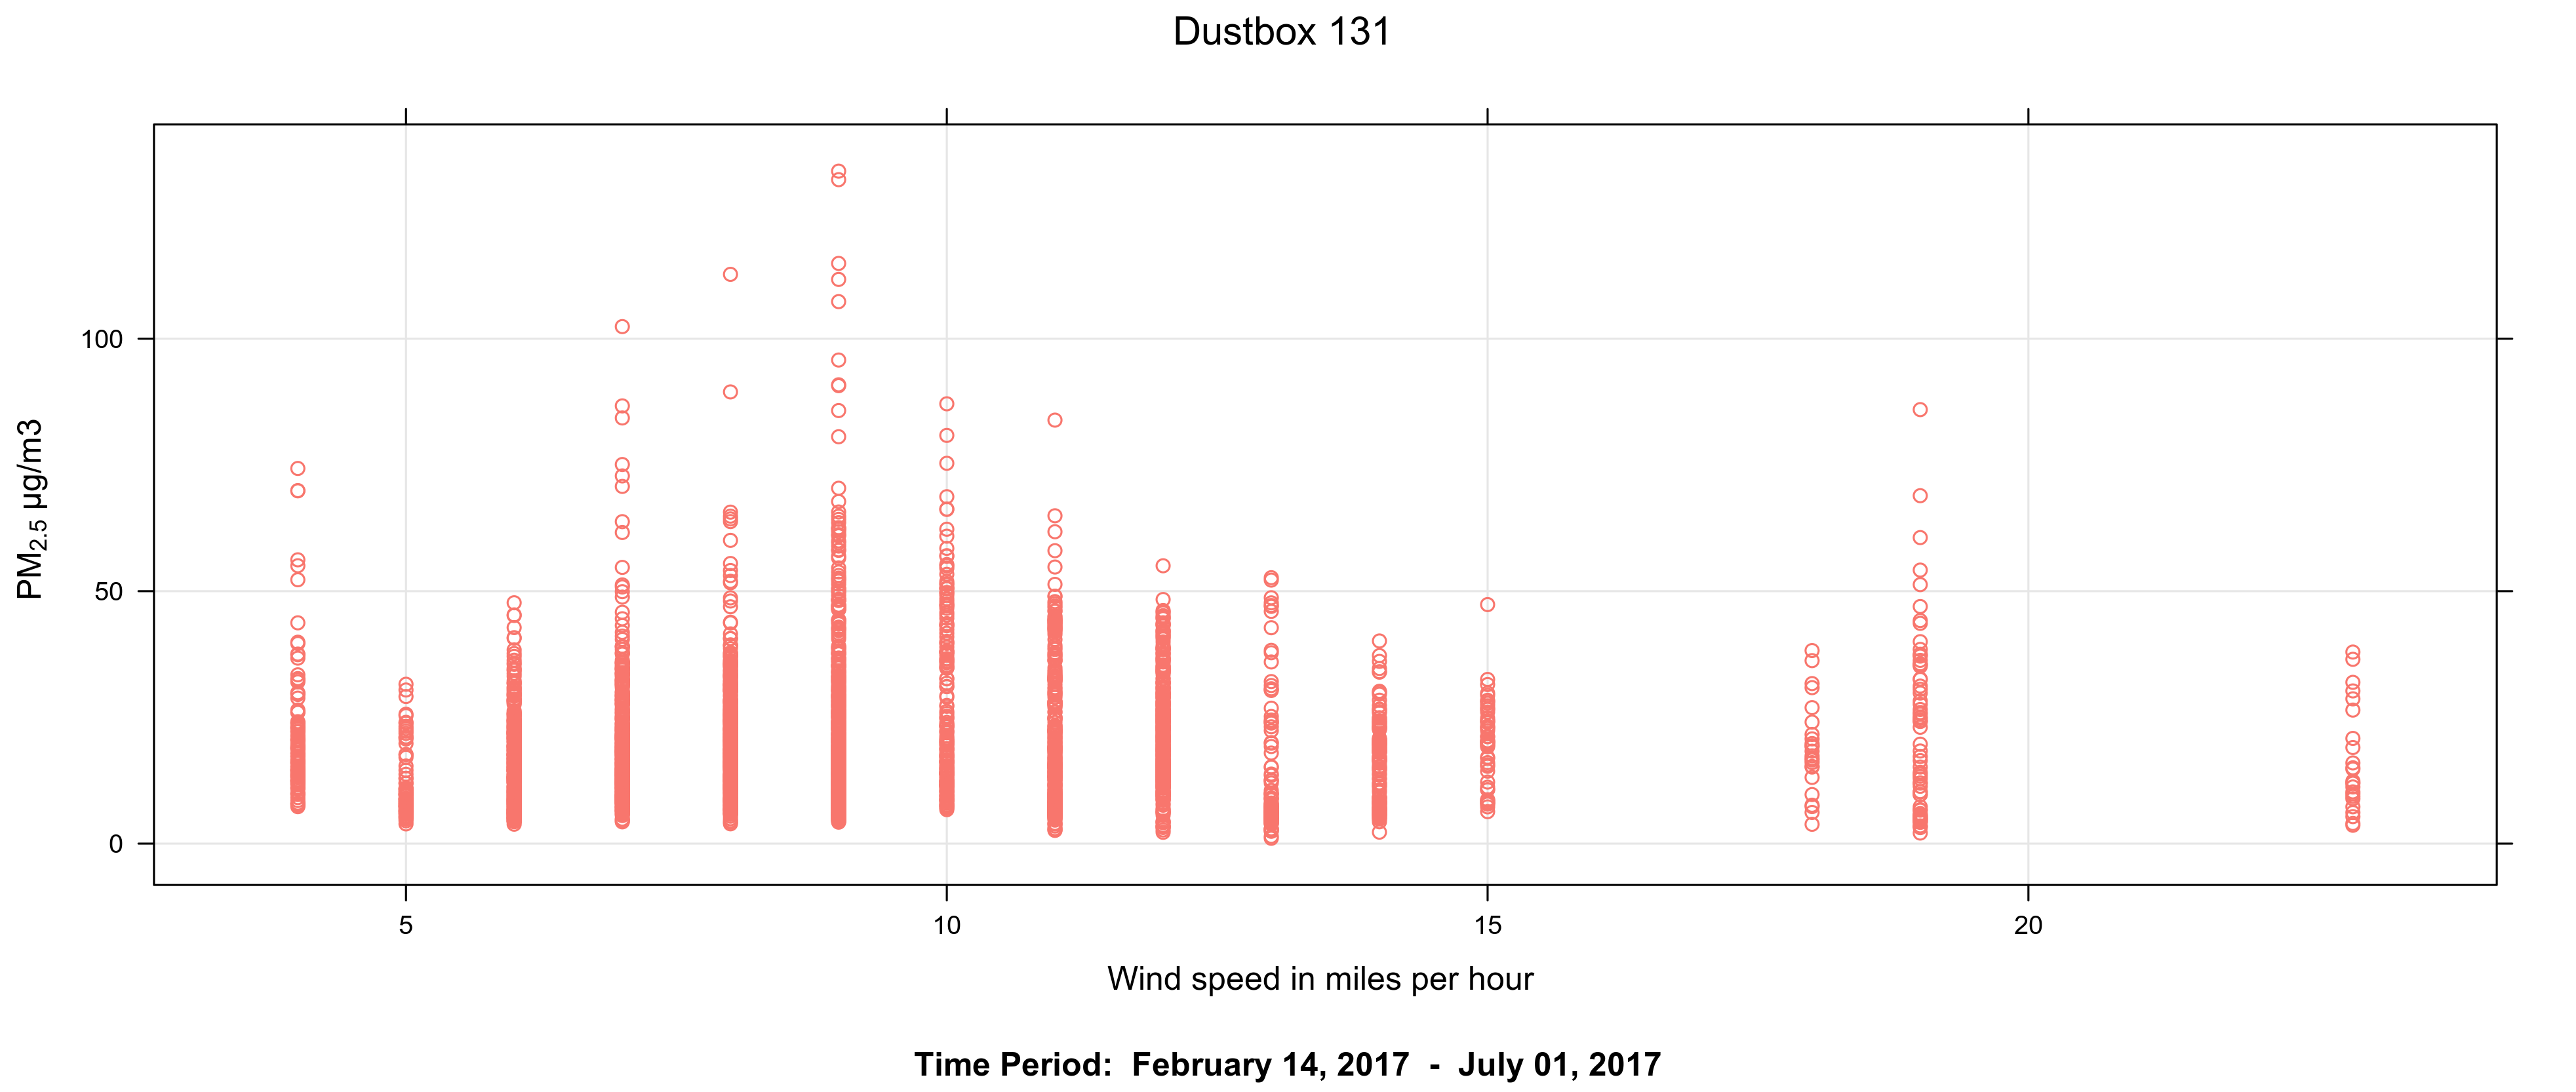
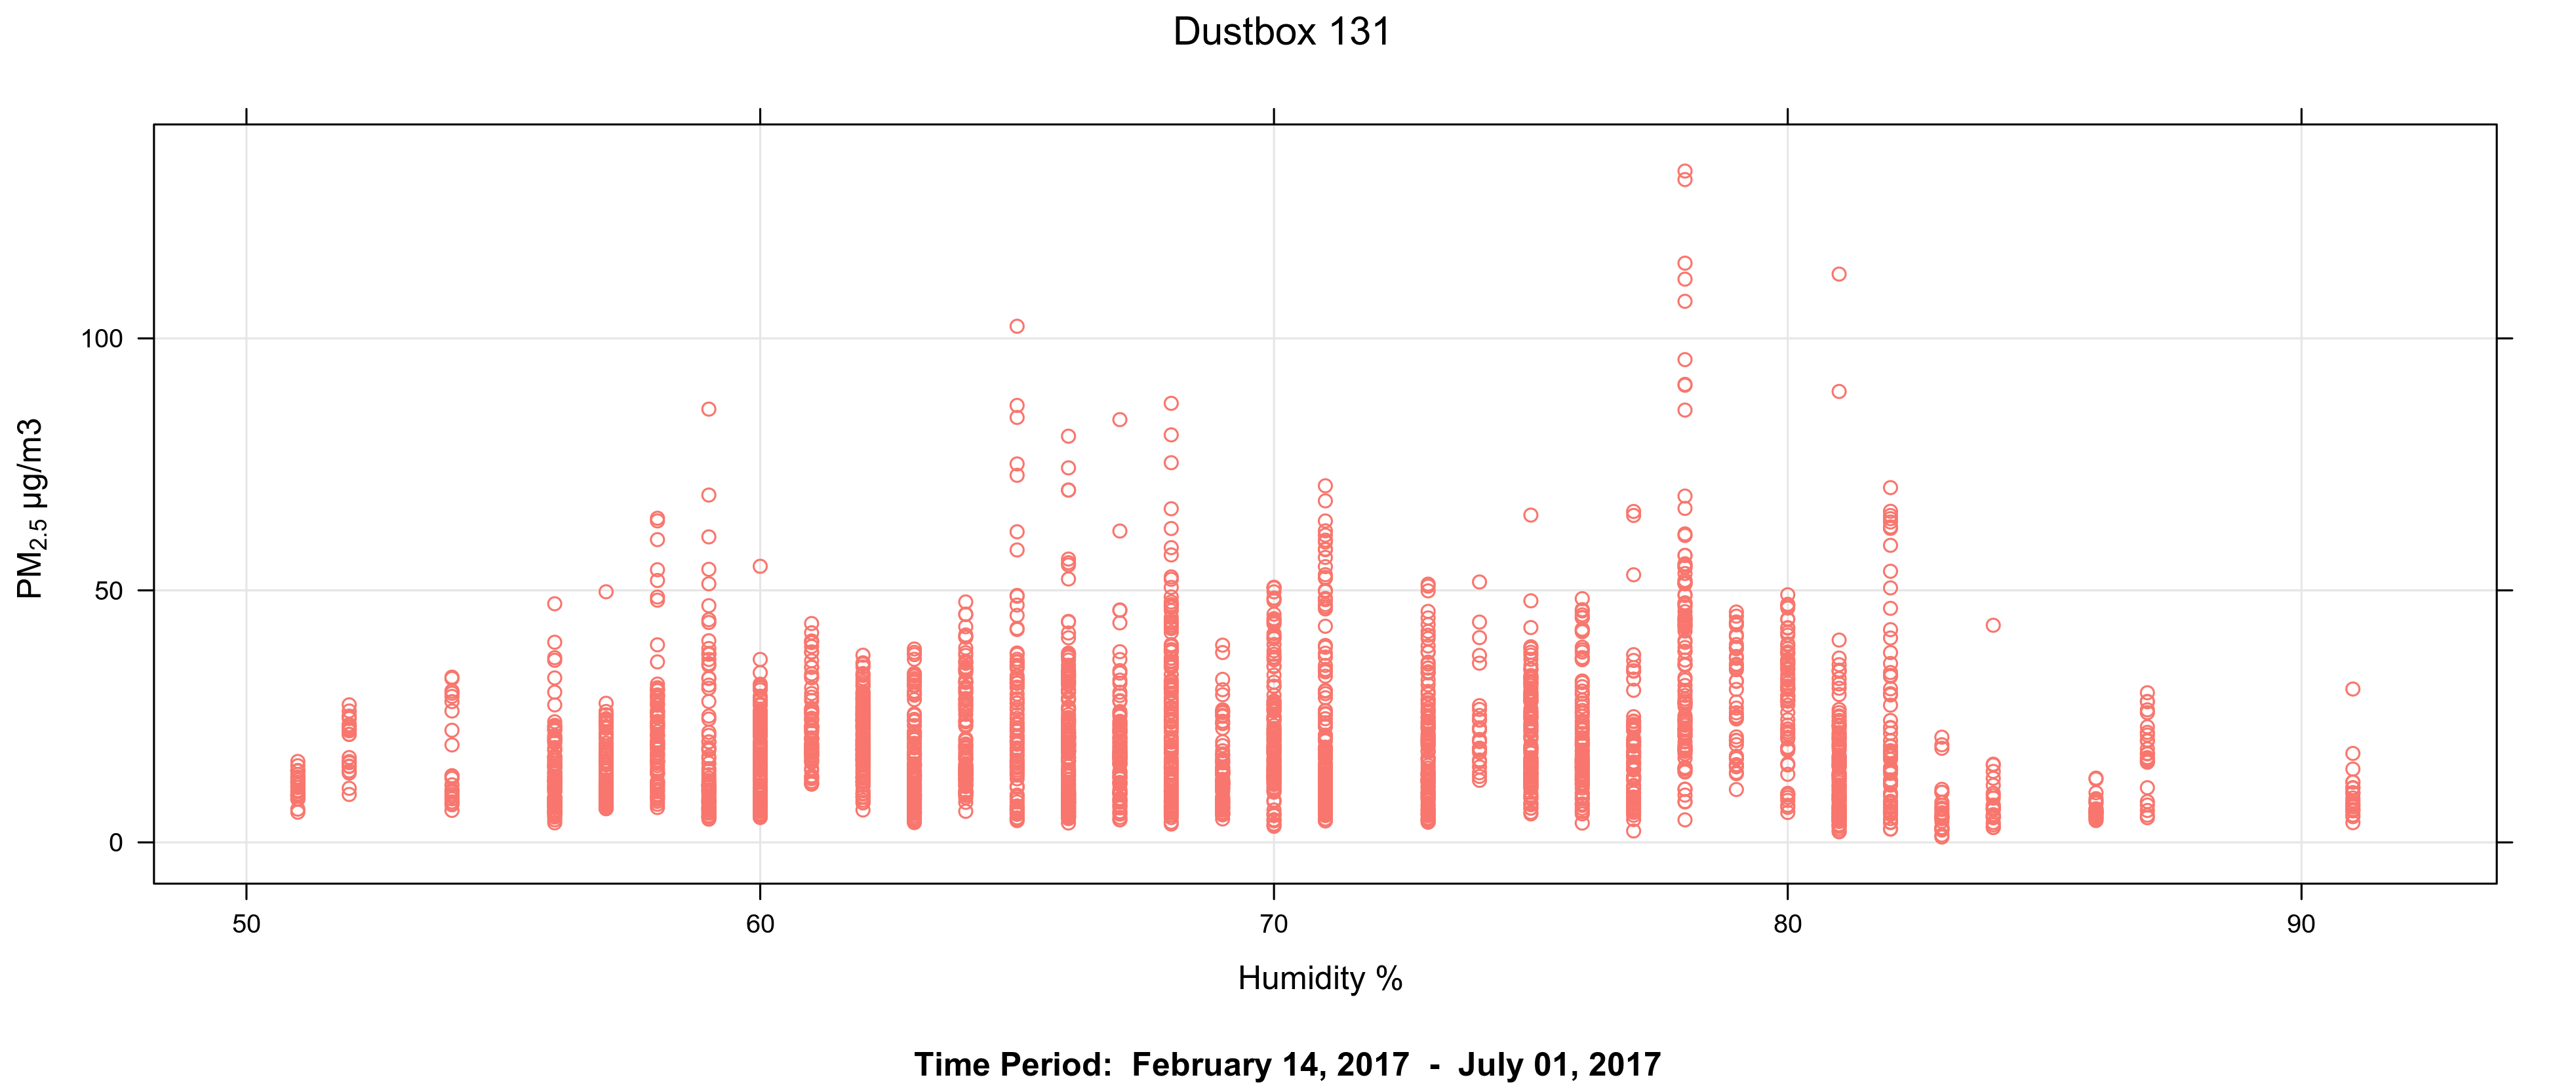
The relationship between particulate pollution concentrations and wind speed is shown in Figure 10. This figure suggests that the main source of PM2.5 at the Dustbox 131 site is not wind-blown dust, as the majority of peak concentrations are recorded during lower wind speeds. This conclusion is supported by Figure 11, which shows that the highest hourly PM2.5 levels were recorded during relatively humid conditions (around 65% to 80% humidity). During high humidity, there would be fewer occurrences of wind-blown dust.
IV. Drawing the evidence together
This data story has drawn together readings collected by Dustboxes 104, 105 and 131, alongside weather data, and contextual information about the local area. Using the tools provided through the Citizen Sense Airsift Data Analysis Toolkit, we have characterized sources of particulate pollution detected in the Deptford Park area as follows:
- While regional sources of pollution were detected, there was clear evidence of additional local source or sources, most likely related to automobile and HGV traffic on Evelyn Street and on roads encircling the monitoring area, based on the analysis of line graphs and “spike” episodes above shared regional levels in London.
- The strongest local source(s) appear to be to the east, northeast and southeast of Dustboxes 104, 105 and 131. Evelyn Street is likely to be a significant source of local emissions from automobile and HGV traffic on roads encircling the monitoring area. Grinstead Road is also evident as a likely emissions source, based on the polar plots at Dustboxes 104 and 105, showing a higher pollutant levels between these two monitoring locations. This could be the result of construction and site remediation on nearby construction sites, as well as automobile and HGV traffic on Grinstead Road.
- The elevated levels of PM2.5 identified at Dustbox 131 are strongest during morning and evenings, and the highest mean concentrations occurred on Tuesdays and Thursdays. These elevated levels are therefore likely to be related to commuter or transit road traffic.
- Some PM2.5 levels are possibly related to re-suspended or wind-blown dust at lower wind speeds and moderate humidity, which are evidenced in the scatter plots above. Dust sources could be industrial activity, construction areas with uncovered ground, HGV traffic, and debris from the waste transfer yard re-suspended on roadways.
- It is clear that traffic has an impact on elevated PM2.5 levels across the Deptford Park monitoring locations. However, construction activity, heavy industry and associated HGV traffic should also be investigated more closely as a likely local emissions source. These additional local sources such as construction sites (including demolition, on-site equipment and wind-blown dust), and industry would add to and exacerbate elevated pollution levels.
V. Actions
In relation to the evidence and findings from the Dustbox citizen monitoring study, preliminary actions are proposed here that take into account the neighbourhood context and existing community organisations and initiatives. The key areas for addressing air pollution include transport, construction, green infrastructure, and additional monitoring. These actions have been developed in consultation with monitoring participants and local area residents. Some actions are shared across the 7 data stories, while others are specific to this data story location:
Traffic and transport
- Building on the Lewisham Council Local Implementation Plan, develop a traffic management plan for Deptford and New Cross in order to identify areas to improve pedestrian, cycle and public transport routes, and to understand the potential impact of the Ultra Low Emission Zone (ULEZ) on the area. Address the impact of new development and increasing population in the area, with a realistic projection of the likely numbers of new cars that will be in the area.
- Undertake an audit of delivery vehicles in the area, especially as they leave the DHL depot on Surrey Canal Road. Vehicles tend to leave in a fleet at 9 am, causing congestion and idling. Staggering deliveries could be one way to improve this.
- Restrict parking in the area in order to reduce the flow of cars through and into the area. Construction vehicles and company vans frequently use free parking around Deptford Park, and free parking encourages the use of private vehicles rather than alternative modes of transport.
- Encourage and support transportation pilots to trial improved roadway design and circulation. Highly successful projects are currently underway, including the partnership between Deptford Folk and Sustrans. Share best practices from transportation pilots, and extend these to other areas, such as pedestrianizing Scawen Road adjacent to the Sir Francis Drake Primary School and Deptford Park.
- Improve cycling opportunities in the area, and separate vehicle traffic from cycling traffic, including through the use of car-free green corridors. Encourage and support cycling initiatives such as the partnership between Deptford Folk and Sustrans.
- Post signs to encourage no idling. Signs that read ‘Turn your engine off’ and include images of people in pollution masks are more effective than text-only signs that read ‘No idling’.
- Encourage hybrid vehicles and buses, and investigate ways to integrate solar panels into the design of buses and bus stops. Allow for electric vehicle charging points to be requested by residents as part of community transport initiatives, and not only by those who own an electric vehicle.
Construction and development
- Ensure the fulfillment of Air Quality Impact Assessments (AQIAs), both at the planning and implementation stage of new developments, in order to accurately gauge the effect of construction with new developments. Develop adequate monitoring and compliance mechanisms for possible breaches of AQIAs.
- Develop planning and regulatory mechanisms for addressing the accumulative effects from construction and new developments. Impacts from construction and new development can include air pollution from demolition and siteworks, traffic during construction, and higher densities of buildings, people and traffic from new developments. Require that all new developments are ‘air quality neutral’, and ensure transparent and legible processes are in place for ensuring neutrality.
- Join up traffic planning across existing and new developments to facilitate walking, cycling and public transport. In relation to Convoy’s Wharf, develop clear plans for the use of Grove Street. In the case of Timber Yard, outline how this development will integrate with existing roads and traffic patterns. In all cases, design for neighbourliness with pedestrianized and play streets.
- Encourage cross-borough collaboration on construction and new development. Pending developments at the edge of Deptford, including the Silvertown Tunnel, the Enderby Wharf cruise ferry terminal, the Knight Dragon development at North Greenwich peninsula, and the Royal Docks Enterprise Zone could have a considerable effect on traffic in the area, especially along Evelyn Street.
- Include plans for managing construction traffic as part of providing planning approval for new developments. Ensure that construction traffic does not exceed set levels so as to avoid additional local pollution events.
- Address and prevent the loss of green space and public space due to new development. Green spaces can have a significant mitigating effect on air quality, and also provide a lower emission space in which people can spend time outdoors.
- Provide indicators for how to measure the effectiveness of dust measurement plans and practices at construction sites. Working with the London Low Emission Construction Partnership, provide mechanisms for enforcing dust management plans when they are not adhered to, and for reporting violations.
Green infrastructure
- Require an audit of green spaces in the borough, including an assessment of the suitability of green space as green infrastructure in relation to air pollution mitigation, and in relation to improving walkability and cycleability. Using existing London tree mapping resources, develop a tree plan for planting in the borough, and in relation to best guidance for trees suitable for minimising and lowering air pollution.
- Plant trees and preserve green spaces in relation to air quality guidance for vegetation. Encourage and support Evelyn 200, an initiative by Deptford Folk to plant 200 trees in 2018, as well as similar community initiatives for greening the area.
- Investigate opportunities for planting air quality enhancing vegetation in existing green spaces including Sayes Court, Deptford Park and Folkestone Gardens, as well as at schools, hospitals, playgrounds and key community sites.
- Provide guidance on planting for air quality, including preferred species, optimal planting arrangements, and best practices for maintenance.
- Host air pollution monitoring and awareness events in green spaces to raise awareness about the importance of urban design and planning in relation to mitigating and prevent air pollution.
Air quality monitoring
- Prioritise air-quality audits of emission levels at Deptford and New Cross schools, in line with the Mayor of London’s initiative. Extend and develop courses in schools for children to learn about air quality and to undertake air quality monitoring in their local area, including promoting actions for reducing air pollution such as walking to school.
- Provide resources for community organisations and residents to continue to monitor air quality over time in order to assess improvements from preventative and mitigating actions.
- Provide resources to undertake speciation to understand the composition and sources of particulate matter, including from roads, construction and other sources.
- Develop protocols and channels for citizens to provide monitoring data to local and GLA environmental health and planning officers, and require officers to act on identified exceedances in relation to air quality guidelines.
Acknowledgements
The Citizen Sense project is led by Professor Jennifer Gabrys. These data stories were developed working in collaboration with Helen Pritchard and Dr Lara Houston. Thanks are due to our collaborators including:
Dr Benjamin Barratt and Khadija Jabeen at the Environmental Research Group, King’s College, University of London contributed to co-location and calibration of the Dustboxes, and Dr Barratt contributed to the analysis of the data stories.
Lau Thiam Kok contributed to the co-development of the Citizen Sense Airsift Data Analysis Toolkits, using and adapting openair software developed by Dr David Carslaw.
Raphael Faeh contributed to the digital design and layout of the “Pollution Sensing” data stories, which provided a model for these “Urban Sensing” data stories.
The Citizen Sense Dustbox included contributions to the printed circuit board design, which was developed in collaboration with Adrian McEwen of MCQN Ltd, and to the ceramic housing, which was rendered into 3D-printable format in collaboration with materials designer Francesca Perona.
Special thanks are due to the participants and residents in southeast London who contributed to the development and testing of the Dustbox monitoring kit, as well as to the collection and analysis of data, and communication of results to wider publics and regulators. For more information on project contributors, see Citizen Sense People.
These data stories are generated using the Citizen Sense Airsift Data Analysis Toolkit, which was developed to allow for citizen-led interpretation of datasets. The core data available for interpretation is the Dustbox PM2.5 sensor data. The Airsift toolkit also brings in air quality data from select sites in the London Air Quality Network (LAQN) for comparison with the citizen data.
In order to blur the exact monitoring locations, the monitoring locations are shown with large blue circles to indicate the approximate monitoring location. Additional citizen monitoring locations are anonymous, and are not included on the Airsift map.
At the start of the monitoring period, the Dustboxes were co-located with the Marylebone Atmospheric Observatory, and a scaling factor was applied to calibrate the devices. Because the sensors were co-located and calibrated during a time of low to moderate pollution, the scaling factor could slightly amplify higher readings in relation to the LAQN readings. However, this would require further testing to demonstrate, since when comparing Dustbox levels with nearby LAQN levels (where available), readings are often comparable.
This data story is prepared under the assumption that all pollutant, cartographic and meteorological measurements are valid and not sufficiently biased to cause misrepresentation of results. Please refer to the Airsift Data Analysis Toolkits and Terms of Use for further information.
The research leading to these results has received funding from the European Research Council under the European Union’s Seventh Framework Programme (FP/2007-2013) / ERC Grant Agreement n. 313347, “Citizen Sensing and Environmental Practice: Assessing Participatory Engagements with Environments through Sensor Technologies.”
To cite this data story, please use the reference: Citizen Sense (2017) “Deptford Park,” Deptford Data Stories, 14 November. Available at: https://datastories-deptford.citizensense.net/deptford-park.
This Deptford Park data story is also available to download as a PDF.