The Pepys area includes high-rise and low-rise residential housing, numerous construction sites and busy roads. Pepys is adjacent to the River Thames. Citizen monitoring in this area indicates that the River Thames is likely to be a pollution source, in addition to PM2.5 from transport and construction activity.
This data story details below how citizen data, weather data and local observations reveal these specific pollution patterns. Drawing on workshops with local residents, the data story also suggests how best to address the problem, from planning for better transport to ensuring that pollution controls are in place for river traffic.
This data story focuses on the northernmost part of Evelyn Ward in Deptford. Historically, this area has been deeply intertwined with shipbuilding, an industry that has dramatically shaped land use. The area has been subject to waves of large-scale housing development from the 1970s onwards, including the Pepys Estate.
Land use is now changing rapidly in the Evelyn Ward as remaining tracts of brownfield industrial land have been sold for redevelopment into high-density mixed-use developments that feature a large proportion of housing. This data story focuses on two monitoring locations in this immediate area, Dustbox 107/234 and Dustbox 145. (Dustbox 107/234 combines data from two Dustboxes as the first device was replaced mid-way through monitoring.)
Local sources of particulate pollution
Particulate matter from road traffic is the most obvious source of particulate pollution in the area. Dustbox 107/234 is on the balcony of a fourth floor flat, facing west onto a grassy park and pedestrian area. Approximately 110 metres to the west of Dustbox 107/234 lies Grove Street (B206) an important thoroughfare, and a potential source of pollution. To the east of Dustbox 107/234 is a quiet estate road, two green spaces, and the Thames riverfront. Dustbox 145 is on a fourth floor walkway facing east onto Grove Street (B206), approximately 12 metres away. The major highway Evelyn Street (A200) lies approximately 135 metres to the southwest, and is likely to be a significant site of particulate emissions from road transport.
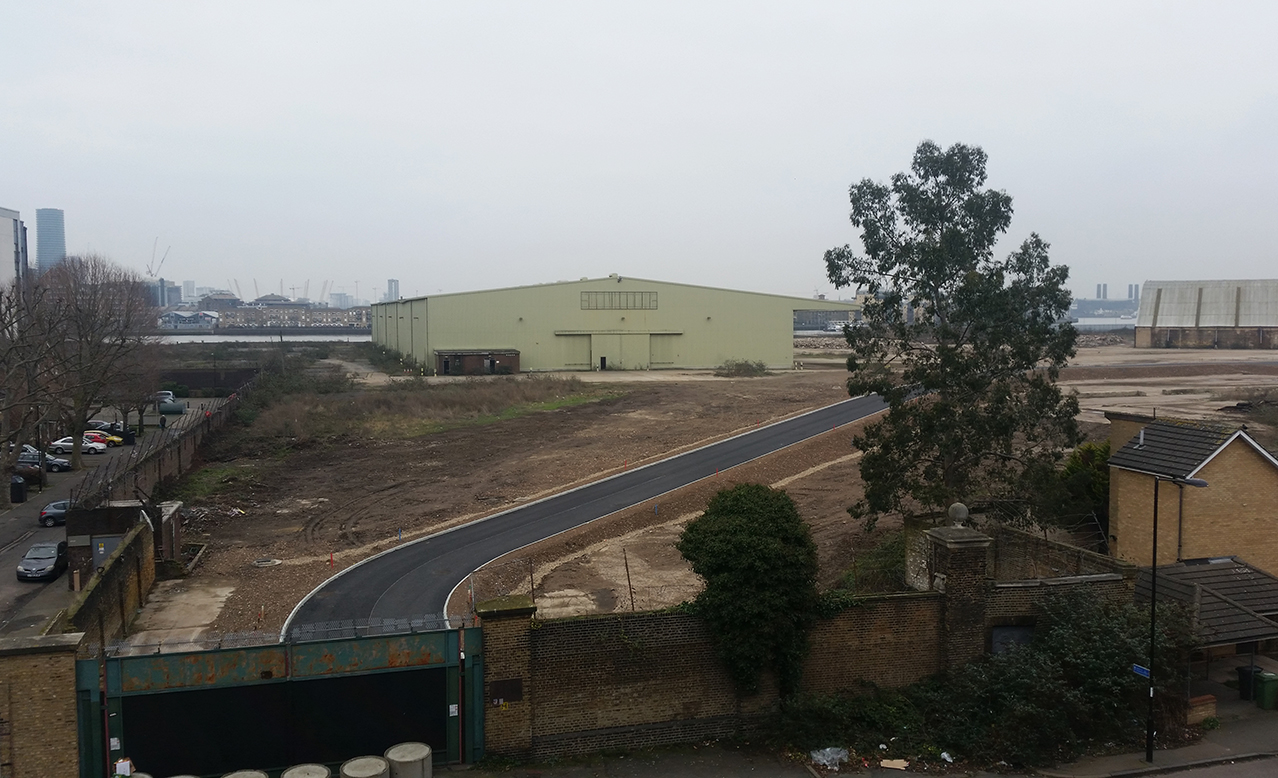
Two former industrial sites are in the immediate area, which have been slated for redevelopment. The largest site is Convoys Wharf, which is 16.6 hectares and has been disused for over a decade. This site could be a source of wind-blown dust. It is located approximately 19 metres to the east of Dustbox 145, and is approximately 215 metres to the southeast of Dustbox 107/234. Groundworks began on the Timberyard site at the very end of the monitoring period. Approximately 195 metres to the east of Dustbox 107/234 is the River Thames. River traffic primarily is powered through diesel-generated vessels, which could be another possible source of particulate matter at both monitoring locations.
Enlarge

London-wide, regional and global sources of particulate pollution
Particulate matter sources in London can be attributed to a broad range of emissions. Within London, PM2.5 from transport (particularly diesel), industry, construction, cooking and heating all contribute significantly to London-wide levels. A significant amount of PM2.5 emissions also comes from heavy industry and agriculture outside the UK, particularly France, Belgium, the Netherlands, Luxembourg, Germany and Poland. These emissions are thought to account for an urban background of approximately 10 µg/m3. The importance of these transboundary effects of PM2.5 emissions from outside of the UK on the total London PM2.5 can vary between 40% to 80% daily depending on weather conditions. When long-range pollution episodes do occur in London, they are generally carried on easterly winds. There are a number of global emissions, events and practices that contribute particulate matter to the total London PM2.5, including fuel production, industrial and domestic combustion, transportation, waste disposal, and agriculture, although these are harder to quantify.
Observations
Participants noted that previous citizen monitoring had taken place in the Pepys area, including in relation to noise and through studying lichens for indications of air quality. Participants were concerned about future construction and effects on air quality, and suggested current monitoring could establish a baseline for the area. Participants documented how transport and connectivity were major problems for mobility and they noted that cars were necessary for travel, especially between Pepys and New Cross, and for accessing schools. Participants observed that there is often considerable river traffic on the Thames. Participants questioned whether SELCHP, the nearby incinerator, could have an effect on air quality. As Pepys has a number of green spaces, participants also noted that these were important assets for ensuring positive urban environmental health.
II. Is there evidence of a problem?
The Dustbox device used to monitor PM2.5 is an “indicative” monitor. This means that measurements can give an indication of pollutant concentrations, but cannot be directly compared with national and international guidelines and standards in an “official” or regulatory sense. Despite this, indicative monitoring is a well-established method within atmospheric science for carrying out initial surveys of an area to establish whether a potential problem merits further investigation. Indicative monitors are also becoming increasingly available for citizen-based air-quality monitoring, similar to this study.
Where possible, the Dustboxes were co-located at the start and the end of the study to account for differences in the sensors and drift during the monitoring period. The co-location of Dustboxes in this data story indicates that there is a good similarity in measurements across the monitors used in this monitoring location, as well as with monitors in the extended community network, both at the start and end of the monitoring period.
The World Health Organisation (WHO) has established a 24-hour mean guideline for PM2.5 of 25 µg/m3 (although there is no safe level of exposure). The time series graphs below show that the WHO guideline was regularly breached between December 2016 and June 2017. The WHO annual mean guideline for PM2.5 is 10 µg/m3, and recent reports indicate that 95% of London exceeds this guideline, often by nearly double, on an annual basis.

Figure 1 shows daily mean concentrations of PM2.5 during an acute pollution episode in February 2017. Two peaks show high levels of PM2.5, that clearly breach the WHO 24-hour mean guideline.
There are many possible sources of pollution in the area, and we have to look at the measurements more closely to see if we can deduce which activities are causing these spikes. Knowing the source of pollution is important as some activities produce more toxic particulate matter than others, and actions to mitigate sources should be targeted to the cause of the problem.

Figure 2 is a time-series chart of daily mean concentrations from 20 February to 20 March. This line graph shows that even outside of acute pollution events, the WHO guideline is still regularly exceeded, suggesting that further investigation may be merited to identify likely sources of emissions.
It is useful to determine whether exceedances were caused by “local” sources of pollution close to the sensor (i.e., within 300 metres), or by regional sources affecting the London-wide area. There may be multiple sources of PM2.5 within the urban areas of Deptford and New Cross, Southeast London and the overall southeast of England region.
Patterns recorded by Dustbox PM2.5 monitors can be read alongside levels recorded by statutory monitoring infrastructure to help determine whether pollution events are occurring across London, or only in localized sites.
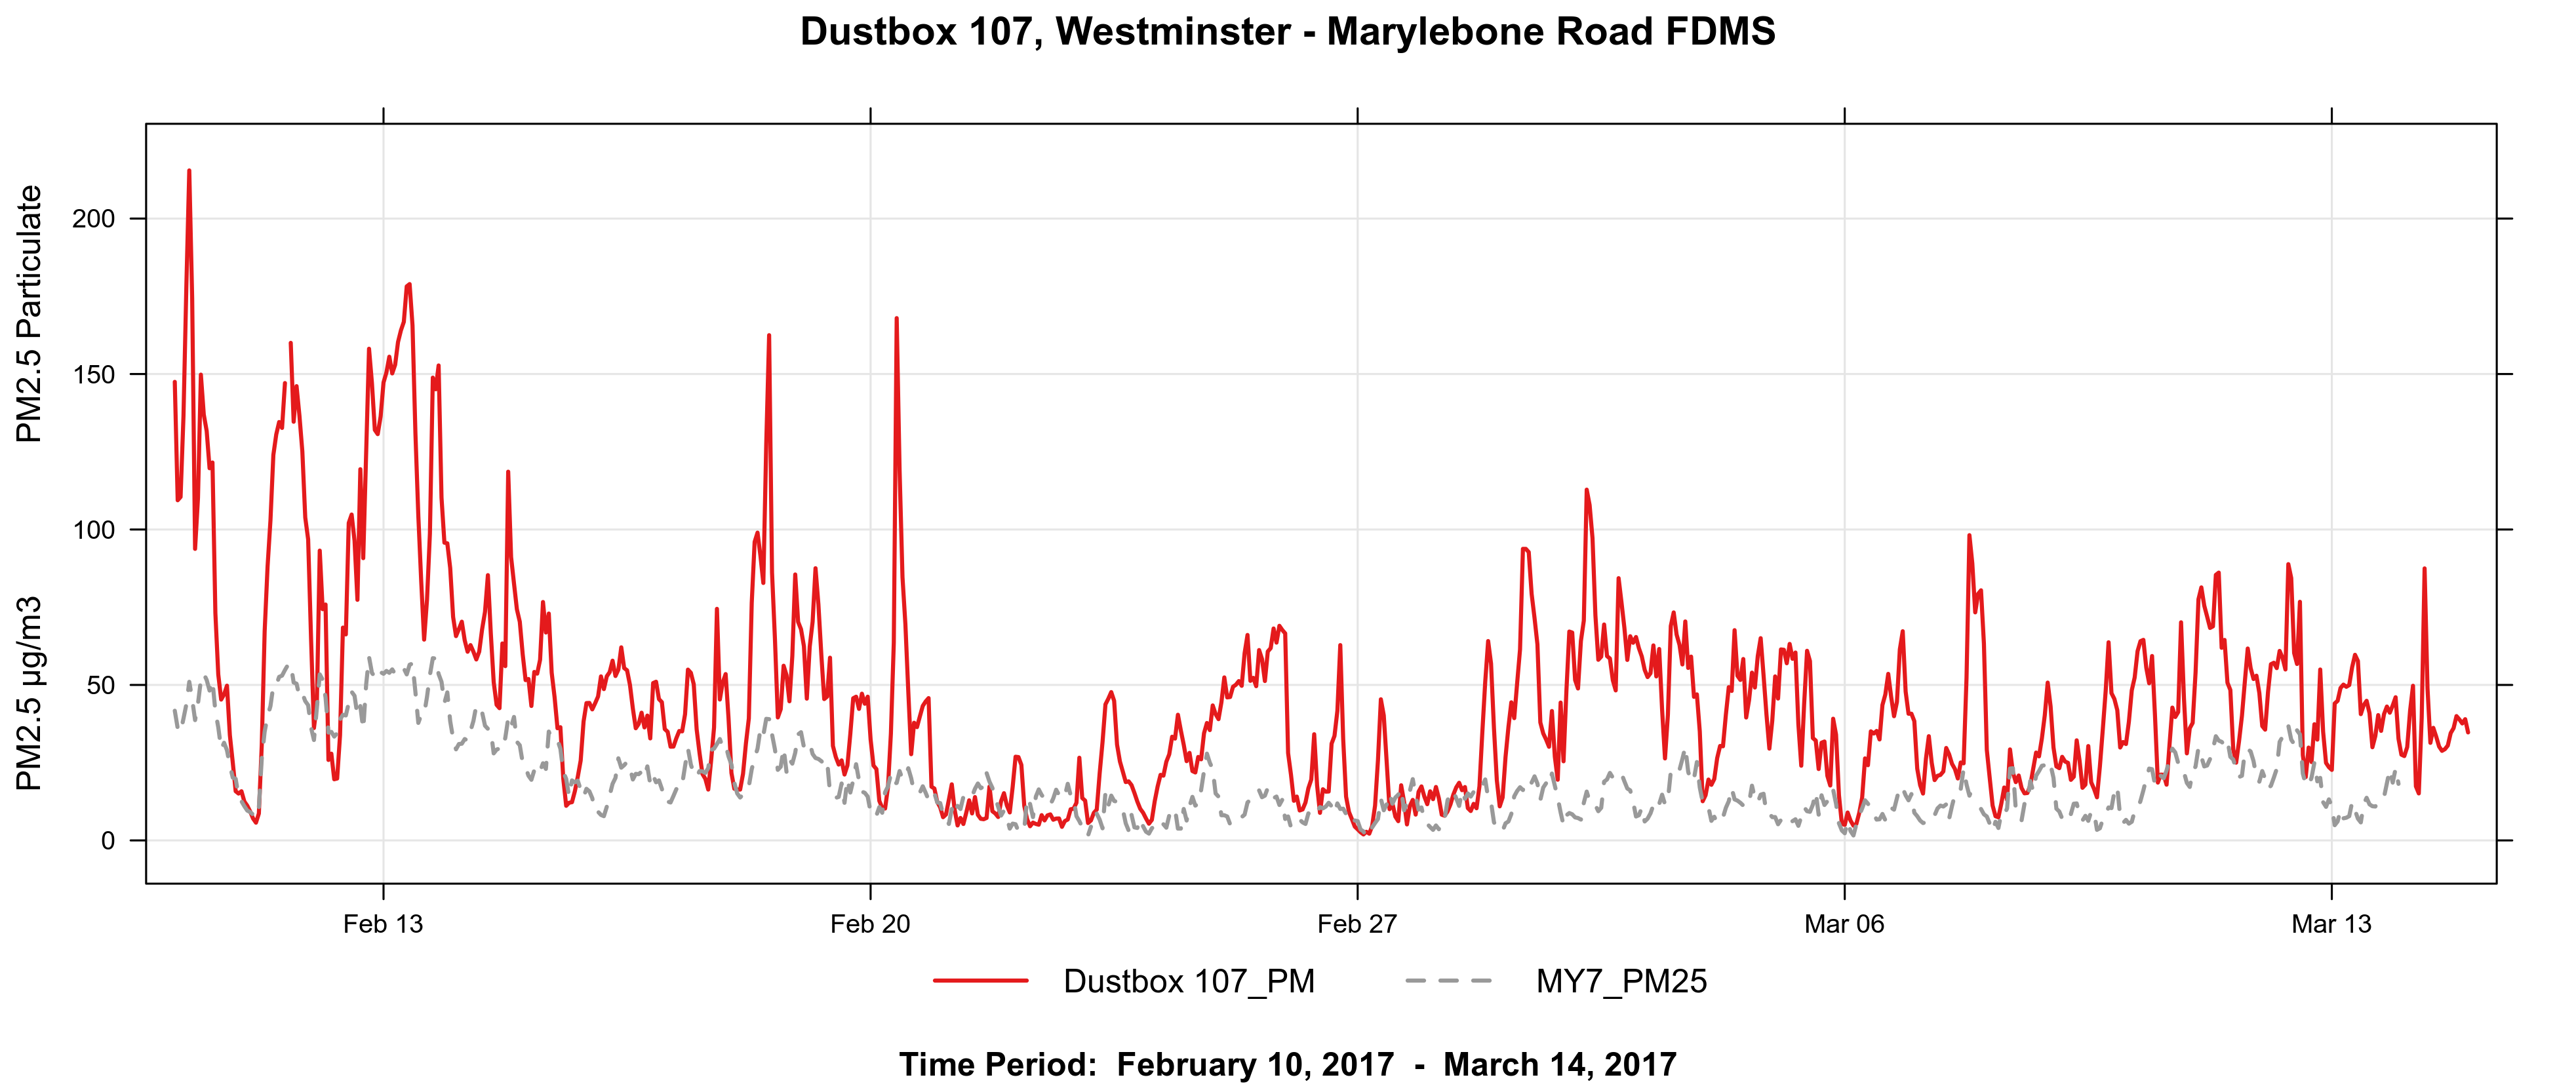
This time series graph shows daily mean PM2.5 levels at the LAQN at the Marylebone site during February – a site to the north and west of Deptford in central London. In line with the Deptford sites Figure 3 shows that PM2.5 levels at the central LAQN site were high from 10 to 15 February 2017. Because the PM2.5 spike shown in the Deptford data was also experienced at the LAQN site, this suggests that a London-wide pollution event occurred. This pattern is corroborated as a pollution episode by the LAQN, which recorded moderate levels of PM10 and PM2.5 in the middle of February across London.
However, Figure 3 also shows that outside of this key pollution event, levels recorded by Dustbox monitors show regular elevated levels of PM2.5 that are not shown at the LAQN site, suggesting that local emissions sources are also a factor in air pollution in Deptford.
III. Characterizing the problem
When is the source most evident?
We are interested in ascertaining possible local sources of pollution around Dustboxes 107/234 and 145. The figures below group particulate concentrations across the monitoring period by hour, month and day of the week.
Patterns emerging within aggregated Dustbox data can provide indications of possible particulate emissions sources. If transport networks were local sources of particulate pollution, we would expect to see higher levels during the daytime, and lower levels at night and on Sundays. Elevated levels might be expected to correspond to peak commuting periods, during morning and evening rush hour.
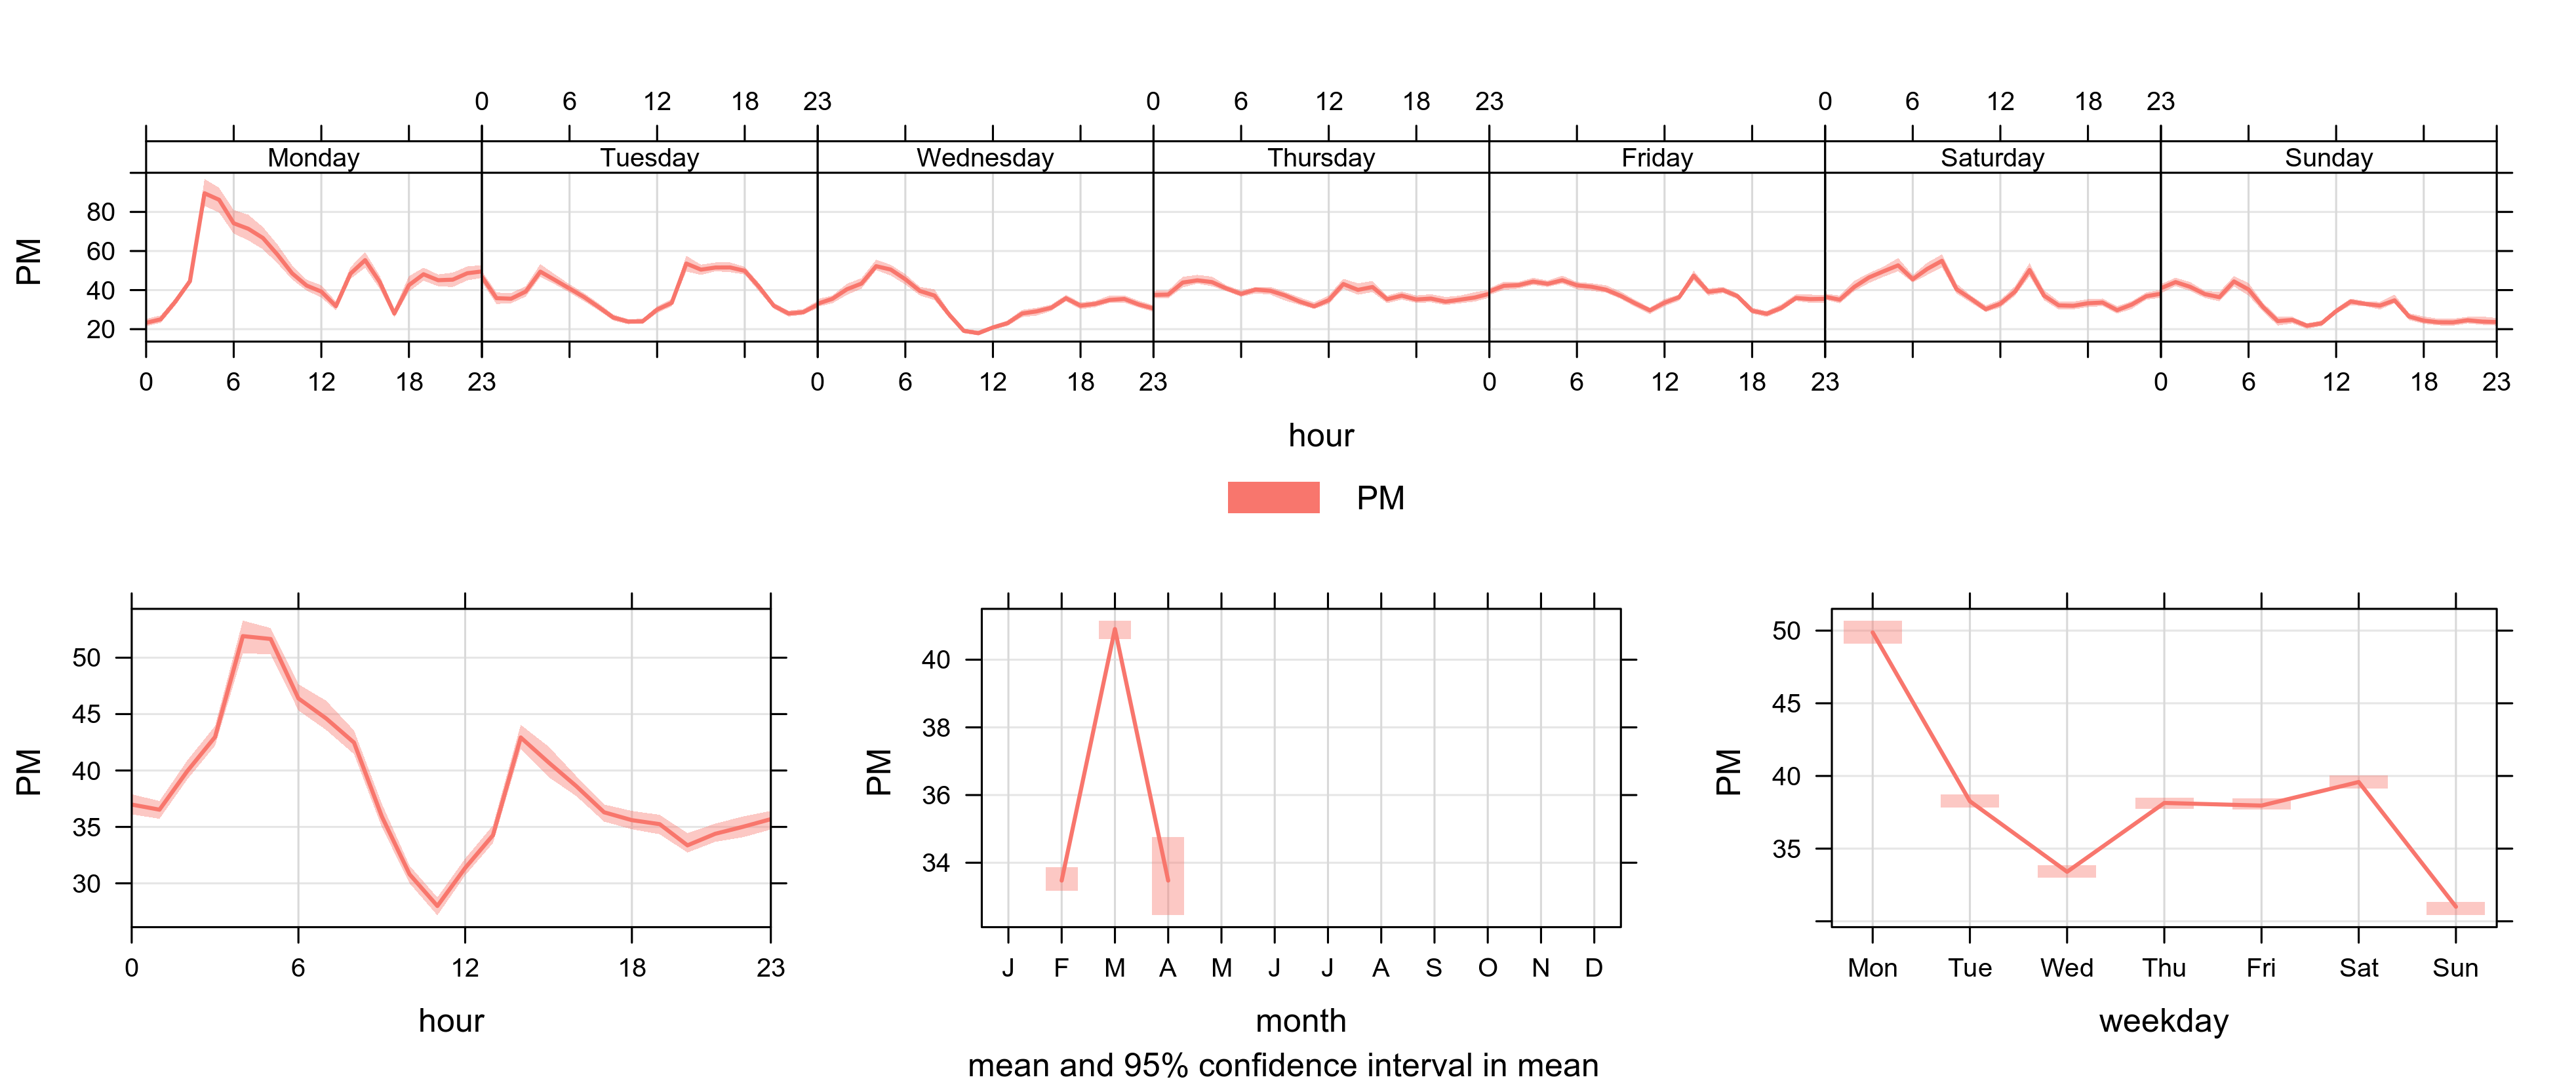
In Figure 4, Dustbox 107/234 levels are highest at approximately 5 am, which could reflect a morning rush hour peak due to deliveries and construction crews. However, the lowest levels of particulates are registered around 11 am rather than during the night, something that requires further investigation. Additionally it appears that these high levels are more pronounced on Mondays.
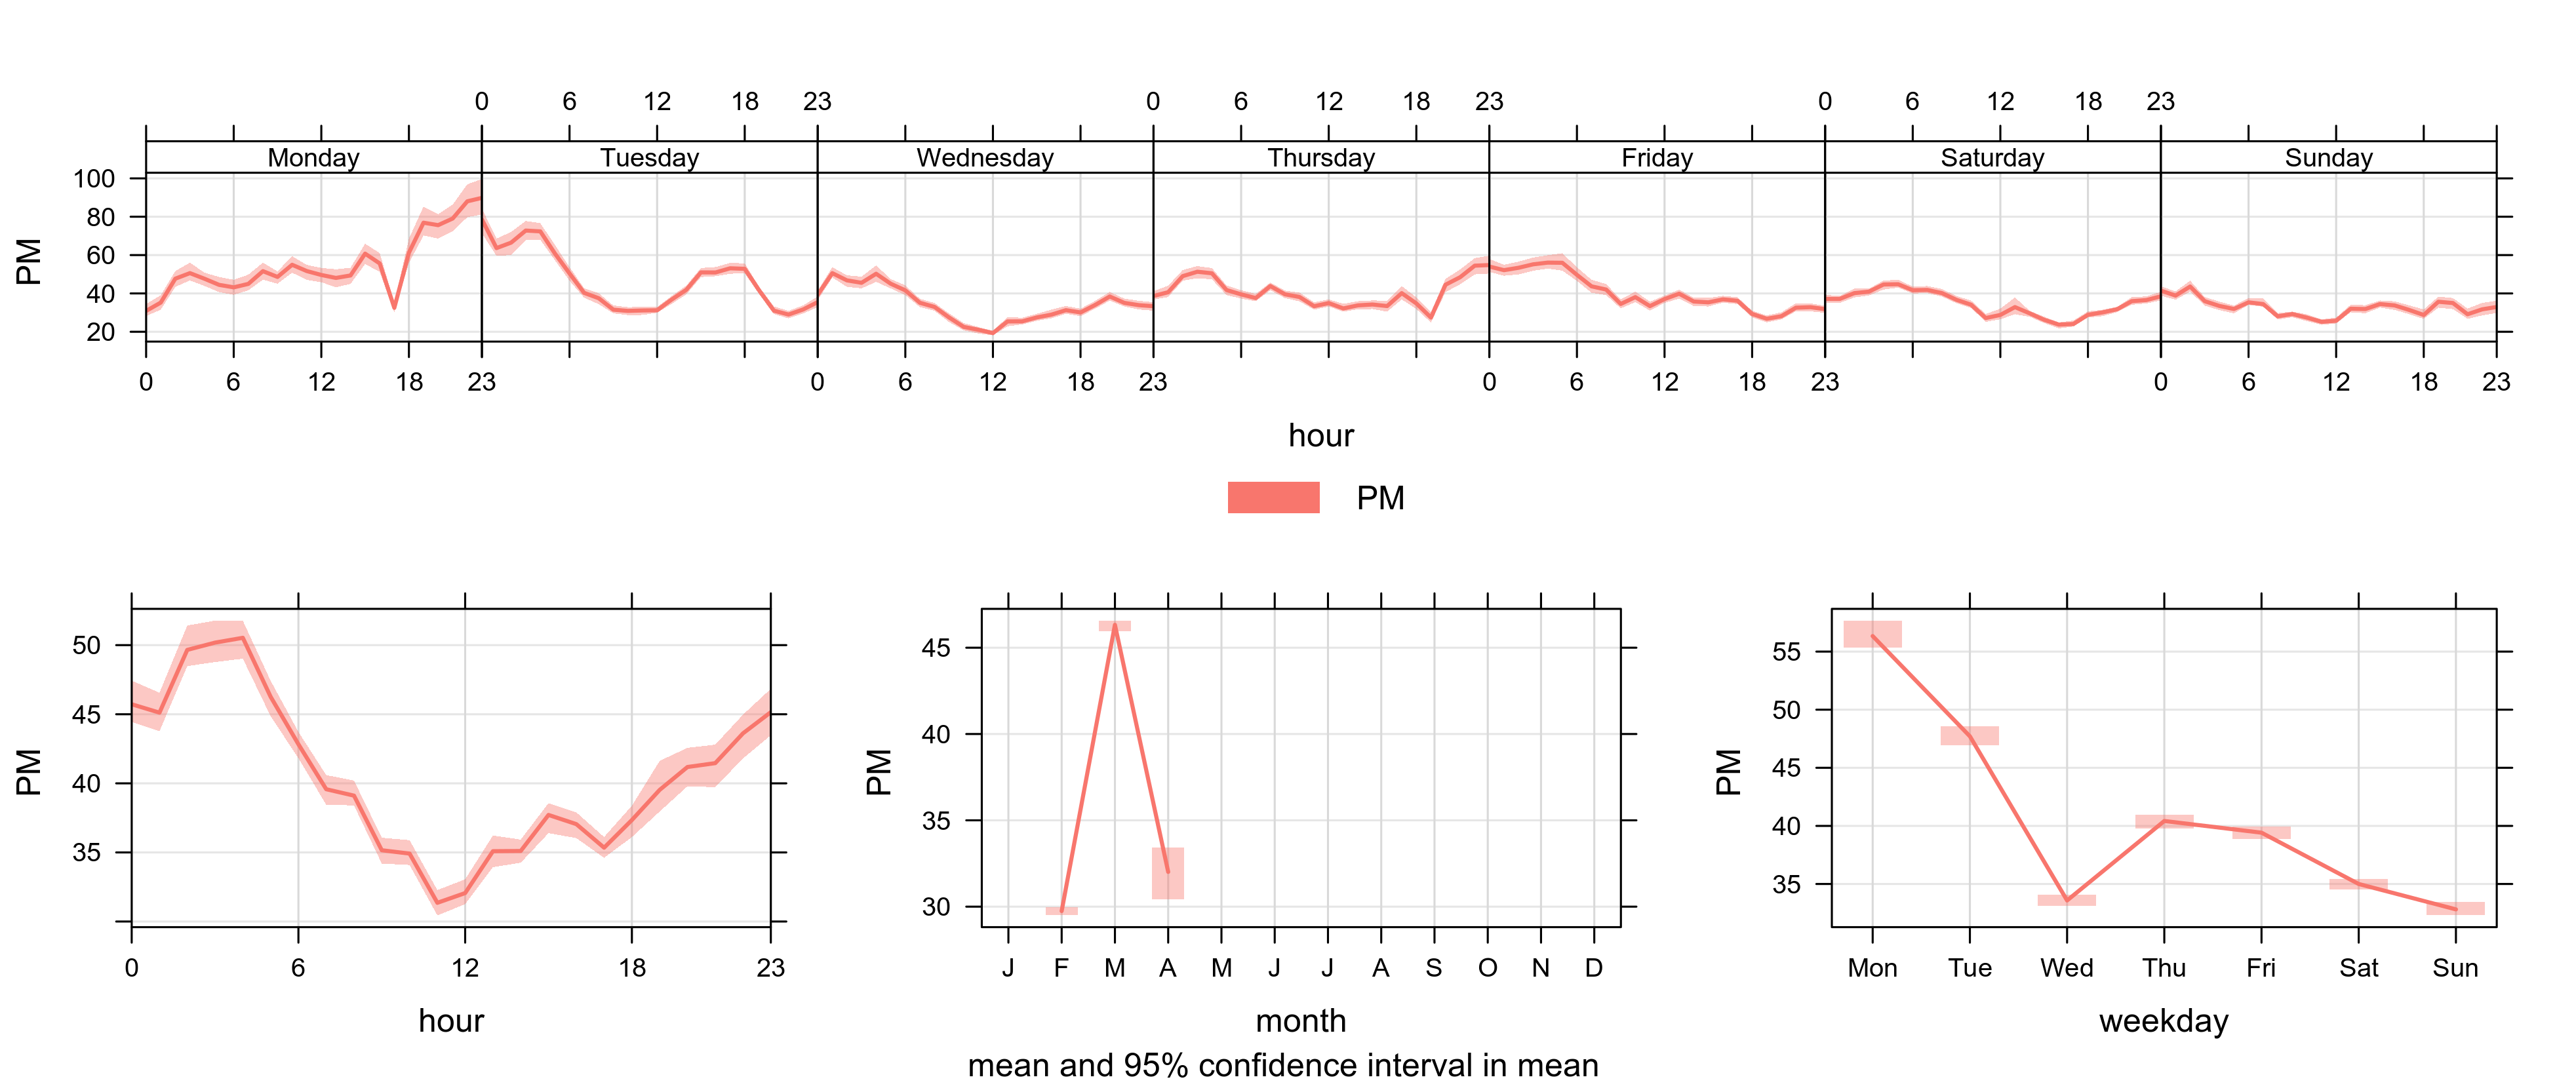
While Figure 5 also shows elevated levels of PM2.5 on Mondays, these are most evident in the evening rather than the morning. Overall, however, PM2.5 levels tend to be highest in the mornings.
It should be noted that the weather plays a significant role in particulate levels. For example, dust tends to be dispersed more slowly during the hours of darkness, as vertical and horizontal wind speeds are generally lower. This phenomenon may skew charts somewhat.
Which direction is PM2.5 coming from?
Particulates are carried by the wind from emissions sources to the monitoring area. The direction and speed of wind are therefore important ways to gauge the locations of emissions sources in relation to the Dustbox monitors.

The scatter plot in Figure 6 shows that the highest peaks of pollution are recorded when the wind is blowing from the northeast to east (50O to 90O), southeast (140O to 170O) and southwest (220O to 270O). The northeast to east signal corresponds with the polar plots below, which suggest that the River Thames could be an emissions source. However, the southwest signal suggests that Evelyn Road could be a possible emissions source.
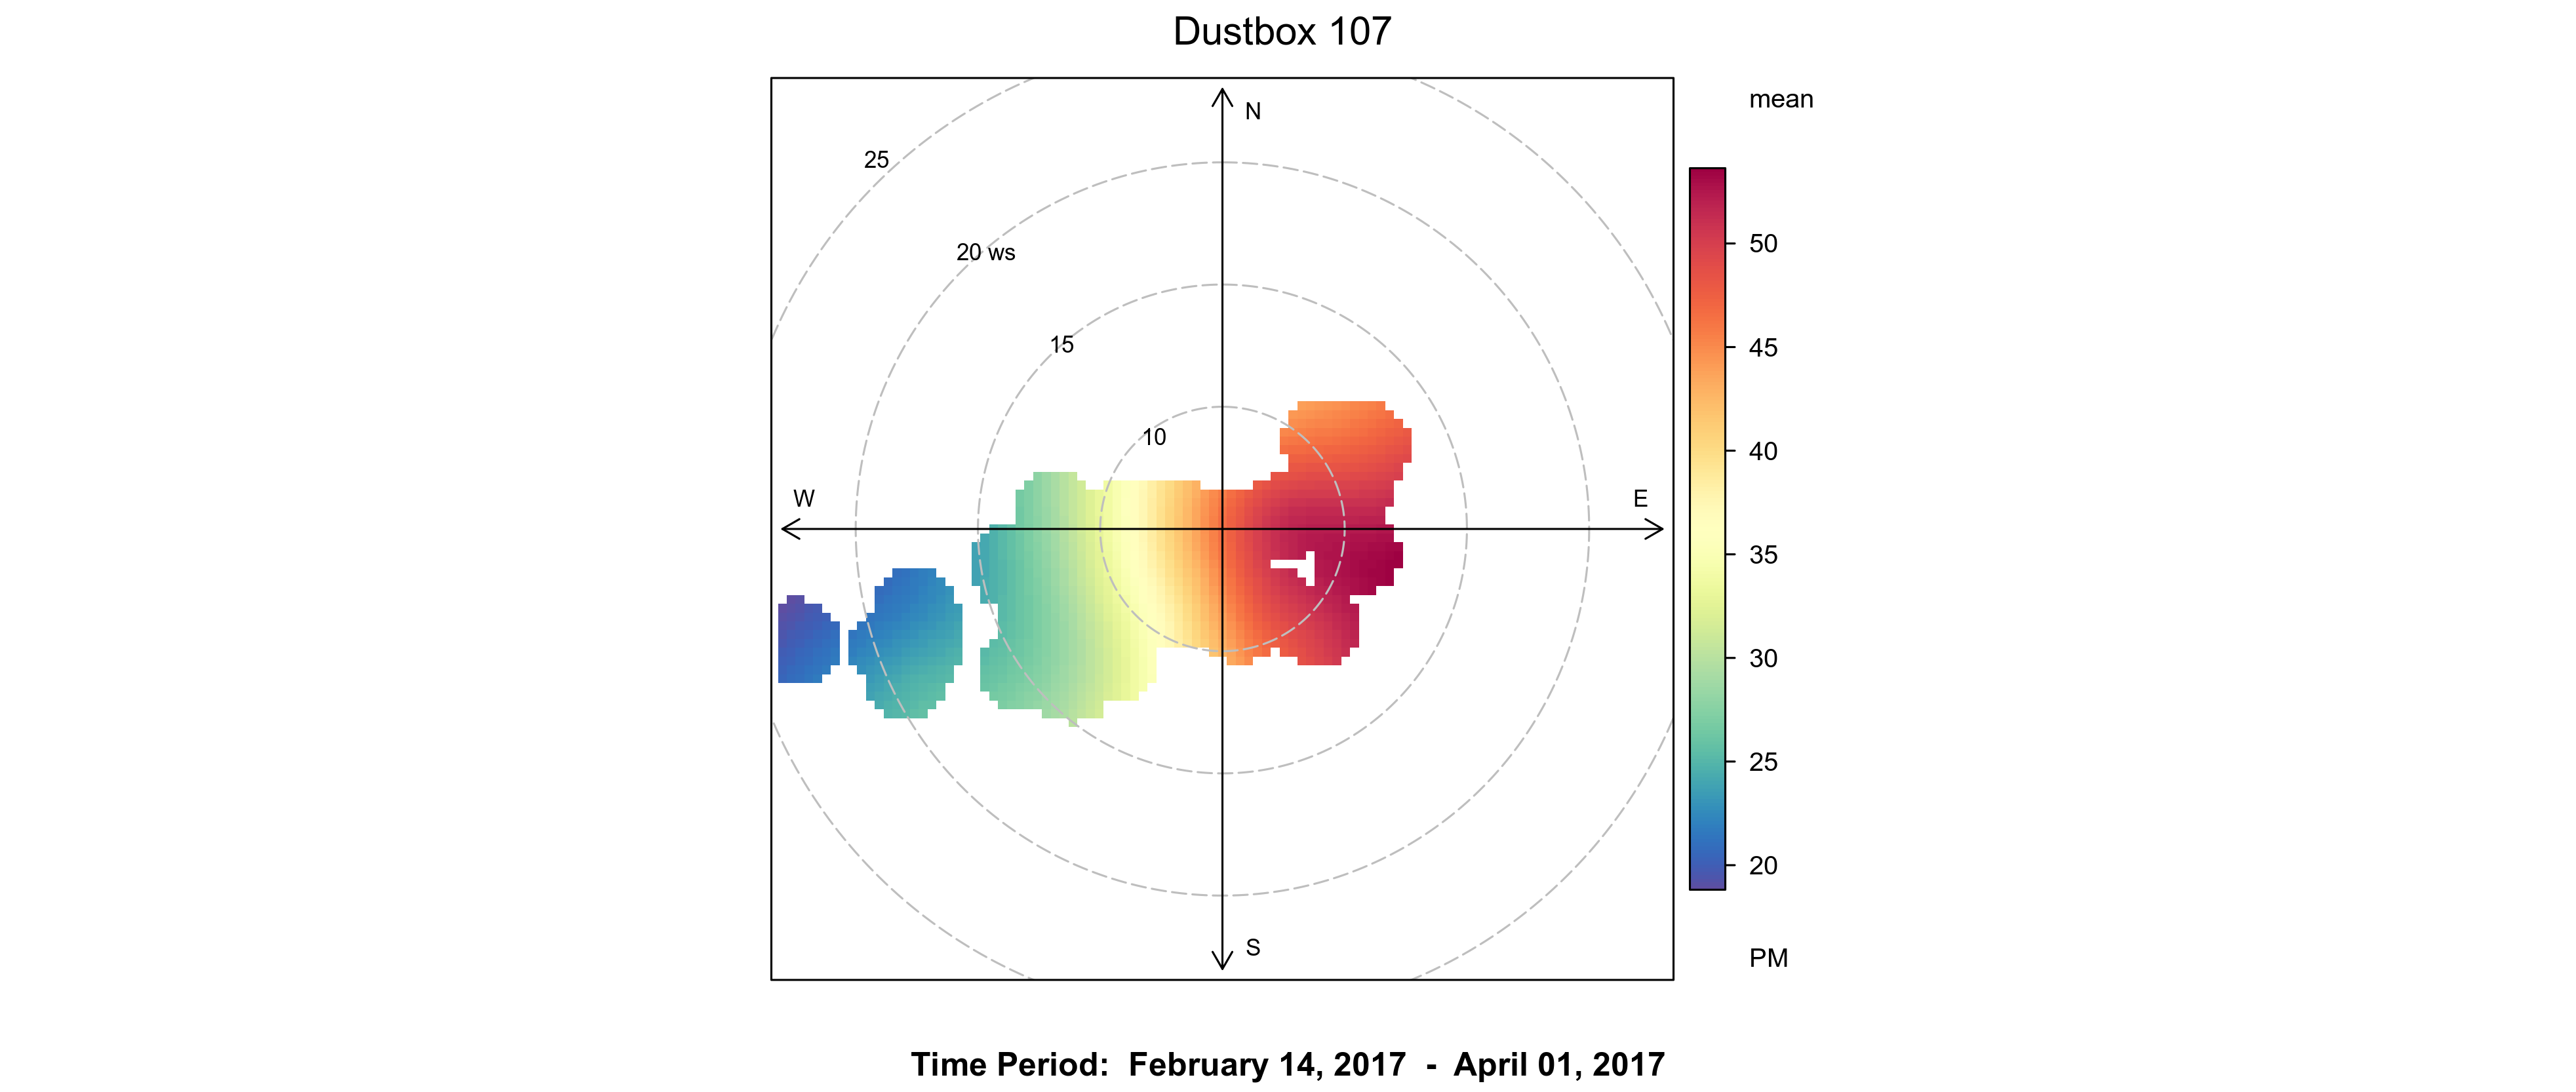
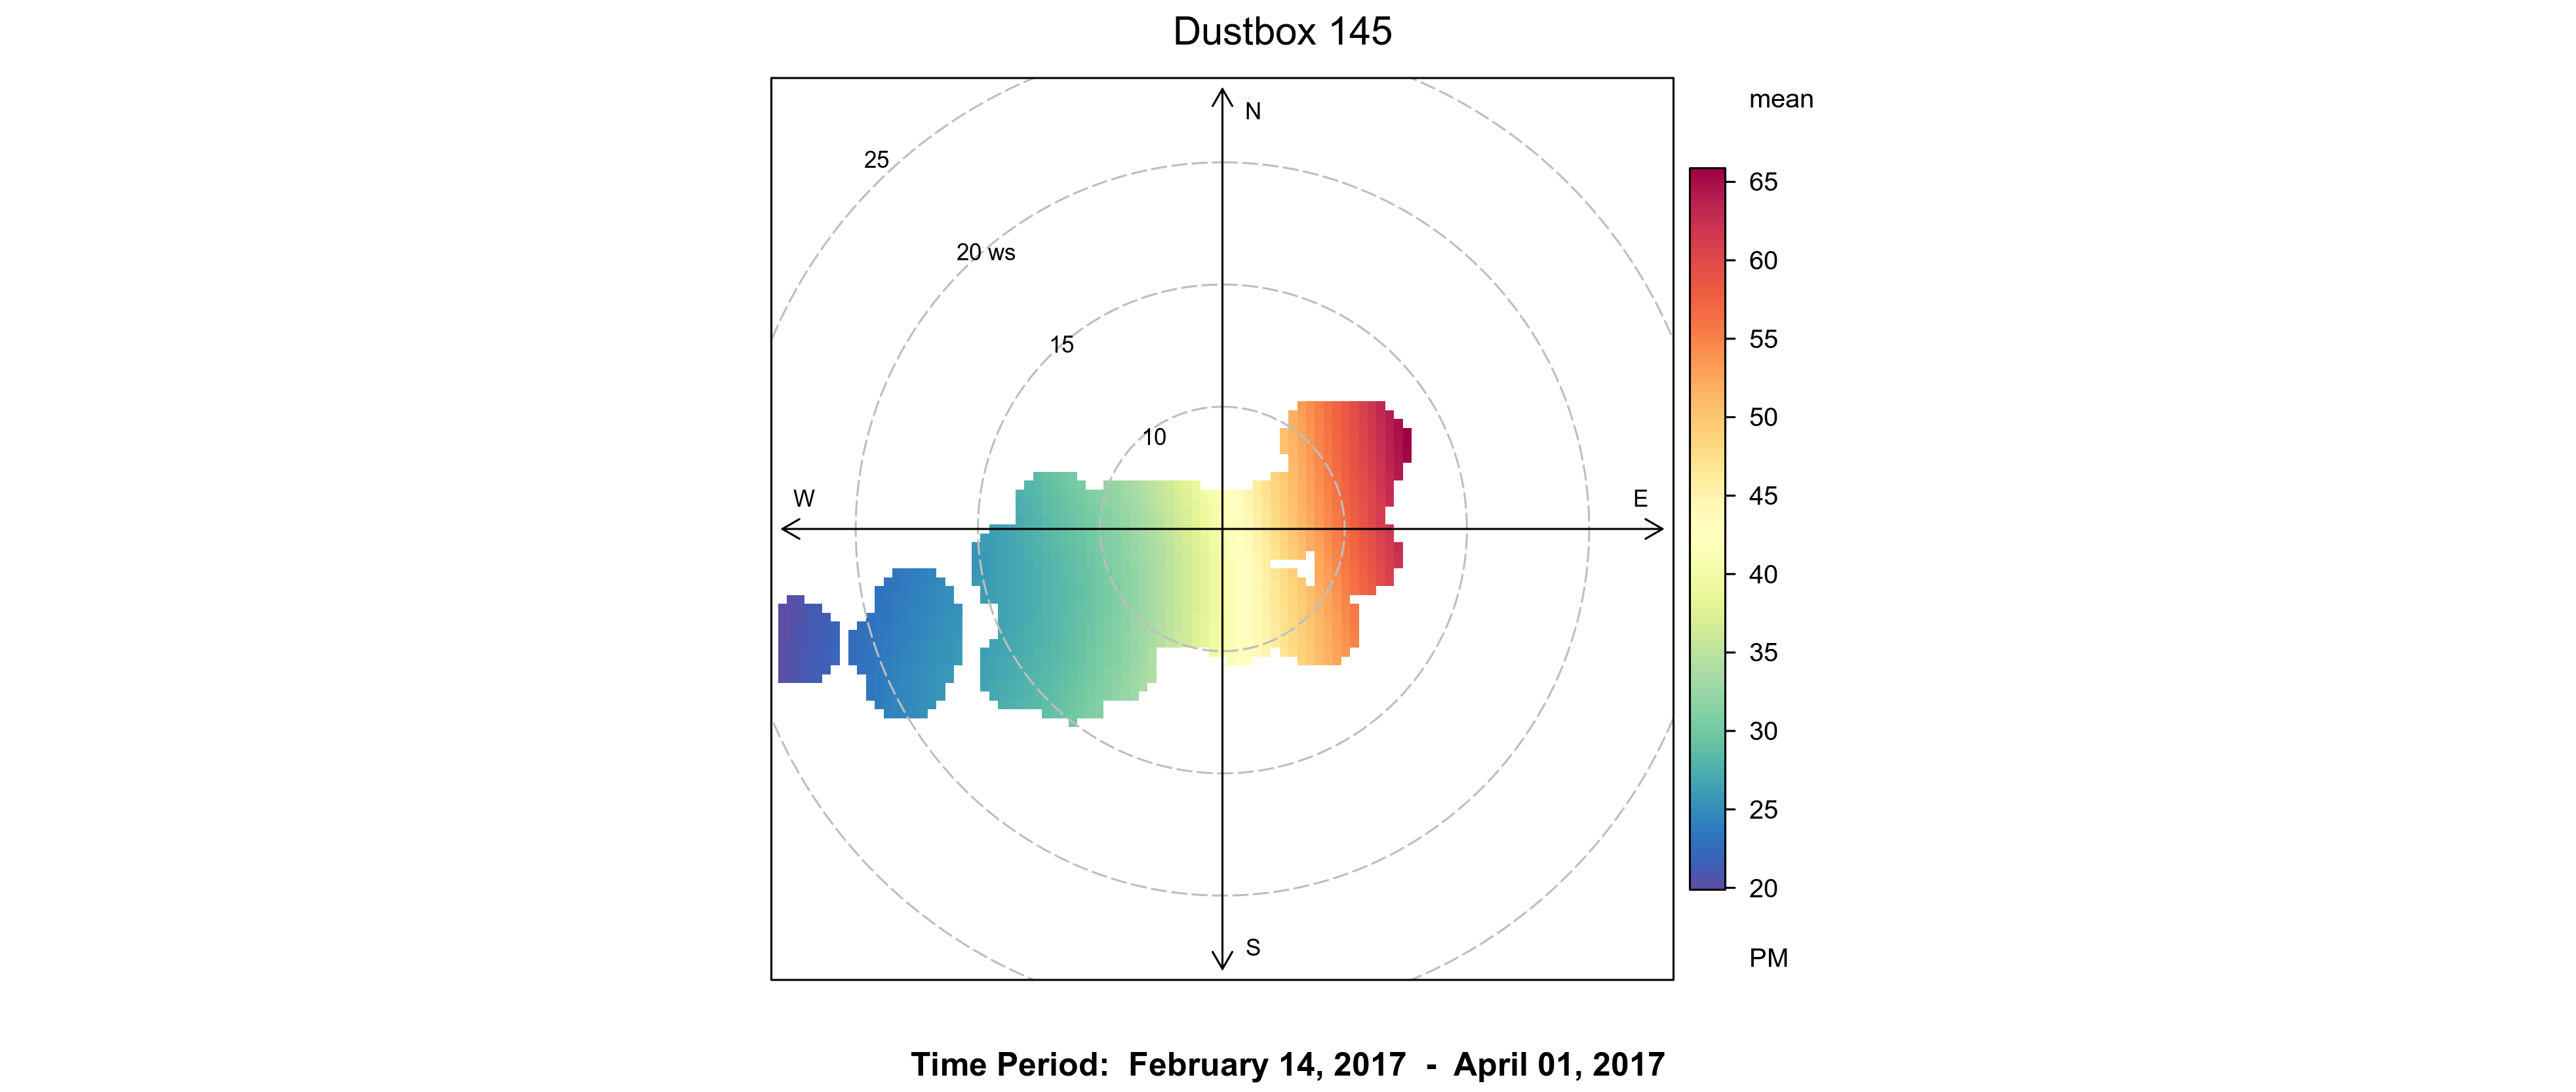
The above polar plots (Figures 7 and 8) also illustrate the relationship between higher pollution levels and wind direction. Colour contours reflect pollutant concentrations in relation to wind direction and wind speed. Calm conditions (zero wind) are shown in the centre, increasing up to 25 metres per second (ms-1) at the outer ring. The highest mean concentrations are shown in red, with the lowest in blue.
We can observe a similar pattern of local emissions sources across Figures 7 and 8. In both monitoring sites the highest levels of particulate matter are registered during local winds to the east. However, the pattern suggests there may be a local source or sources to the northeast of Dustbox 145 and to the southeast of Dustbox 107/234. In addition, Dustbox 107/234 may be closer than Dustbox 145 to a source or sources in the east.

The polar plot in Figure 9 is provided as a comparison with Dustboxes 107/234 and 145 to indicate that while there is an easterly source of emissions at a regional level, levels at the two Dustboxes are higher than the regional levels at this urban background site. This suggests that there are additional local sources at the Dustbox 107/234 and 145 locations.
Under which weather conditions are PM2.5 levels most evident?
Different sources of pollution will behave in distinct ways according to the weather. For example, windblown dust will primarily occur during dry, windy conditions. Sometimes, you can learn about a source by characterizing this weather-related behaviour.
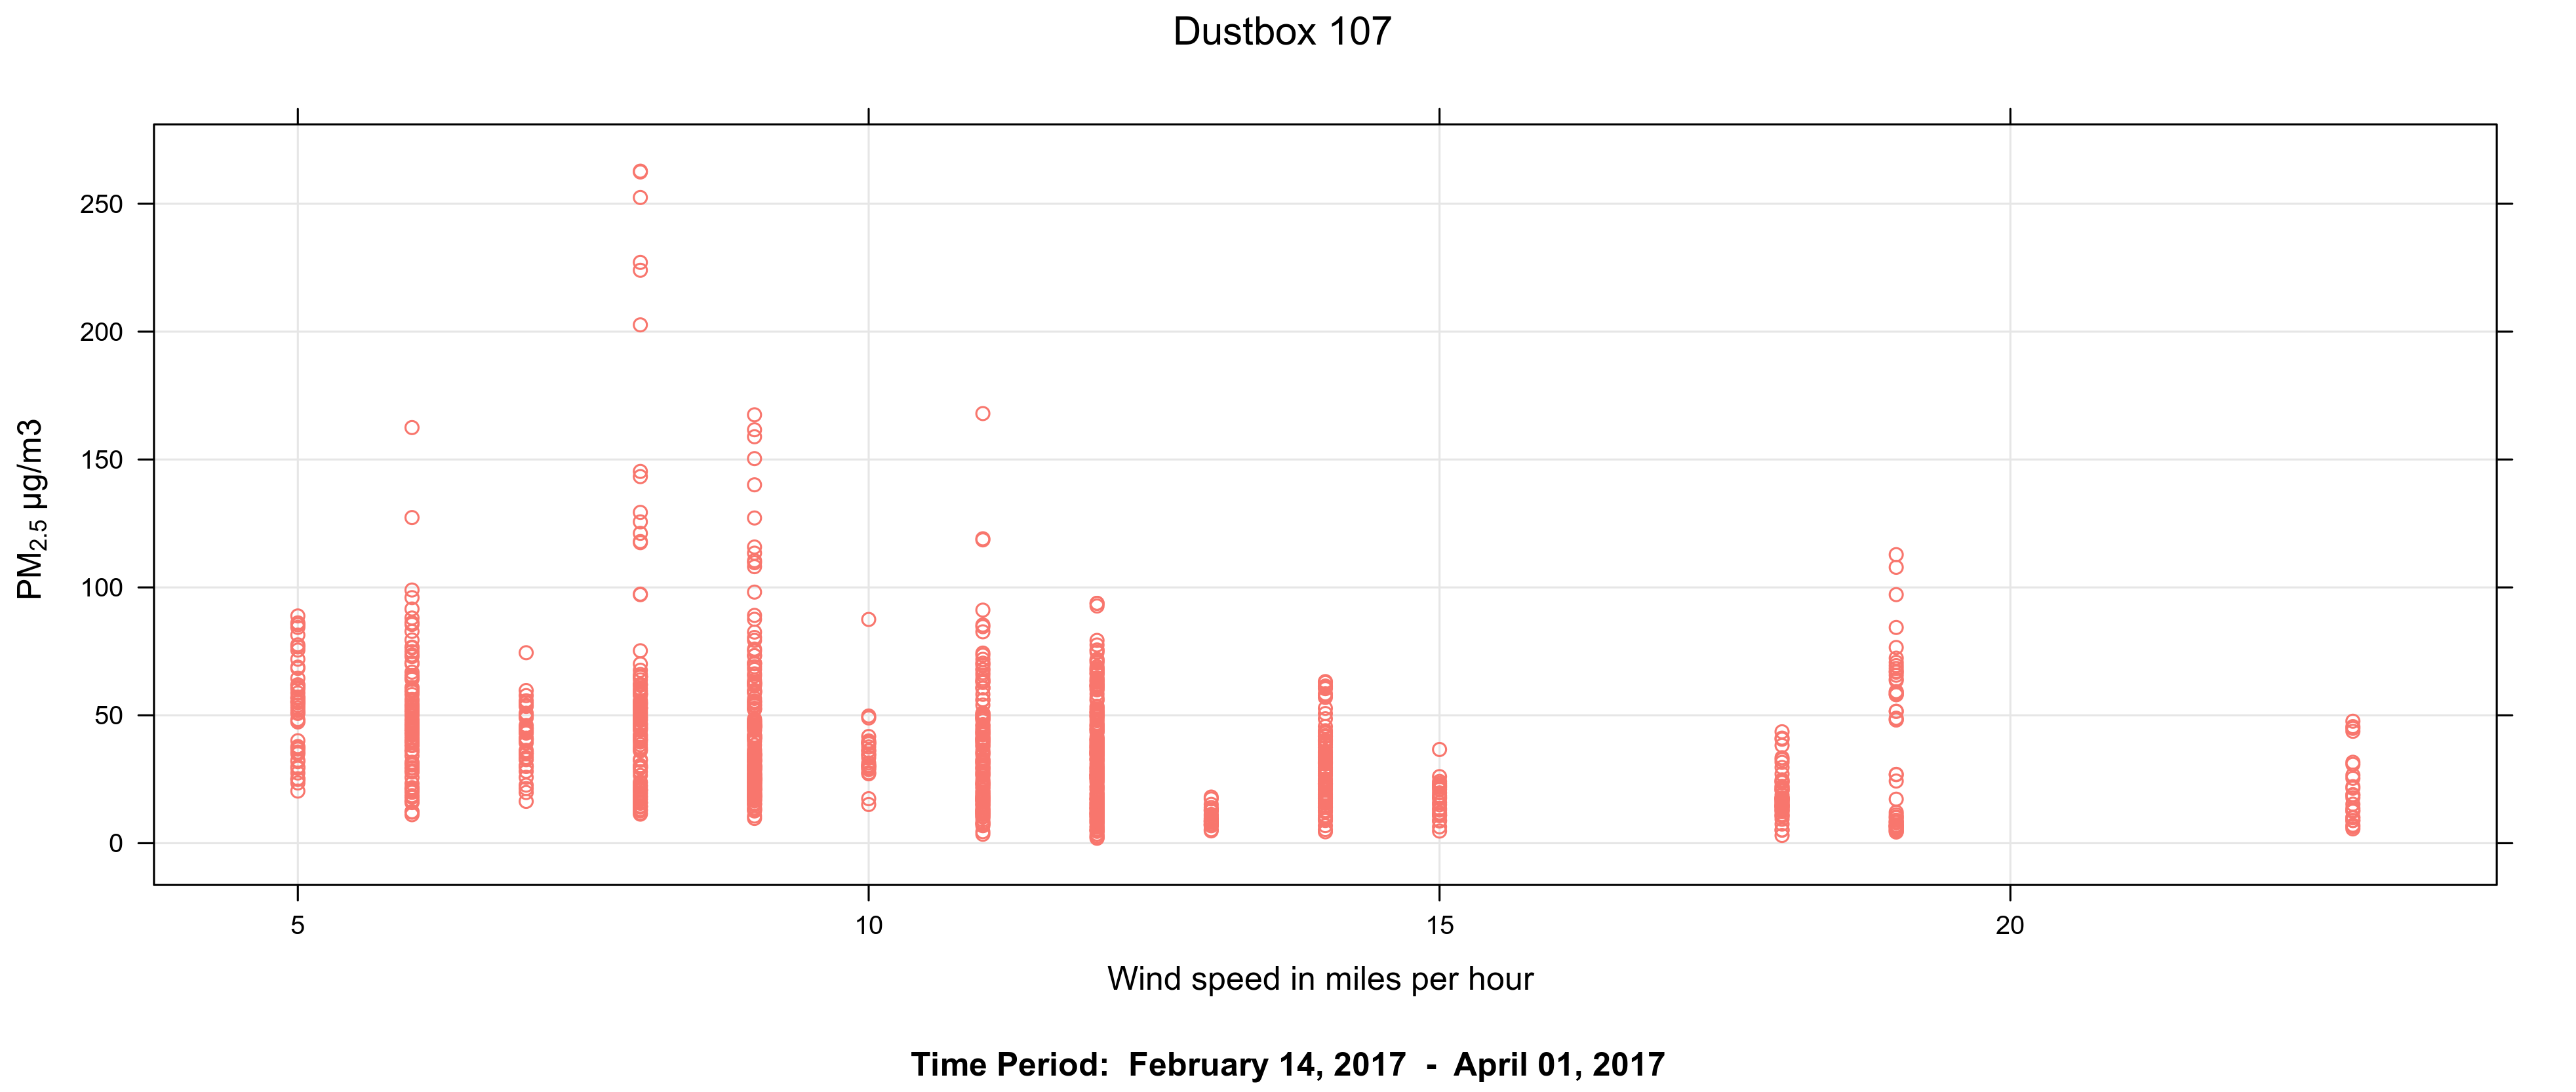
The relationship between particulate pollution concentrations and wind speed is shown in Figure 10. The highest concentrations are recorded at lower wind speeds, suggesting that the main source is not wind-blown dust.

The highest PM2.5 readings occur at levels of relatively high humidity between 60% to 85%, as shown in Figure 11. During high humidity there would be fewer occurrences of wind-blown dust.
IV. Drawing the evidence together
Using the tools provided through the Citizen Sense Airsift Data Analysis Toolkit, we have characterized sources of particulate pollution detected in the Pepys area as follows:
- While regional sources of pollution were detected, there was clear evidence of additional local source or sources, most likely related to road traffic at Evelyn Street and river traffic at the River Thames, based on the analysis of line graphs and “spike” episodes above shared regional levels in London.
- The strongest local source(s) appear to be to the east, northeast and southwest of the Dustbox 107/234 and Dustbox 145 monitoring locations. Evelyn Street is likely to be a significant source of local emissions from road traffic. However, the higher levels of pollution are from the east and northeast, suggesting the River Thames could be a significant emissions source. It is less likely that Convoys Wharf is a source of wind-blown dust, as particulate levels are higher during episodes of lower winds and higher humidity.
- The elevated levels of PM2.5 identified at Dustboxes 107/234 and 145 are strongest during the morning and evening, and the highest mean concentrations occurred on Mondays. These elevated levels are therefore possibly related to road traffic from construction crews, delivery vehicles and commuters.
- It is clear that traffic has an impact on elevated PM2.5 levels across the Pepys monitoring locations. However, the River Thames should also be investigated more closely as a likely local emissions source. River traffic could be contributing to the elevated levels of pollution traveling from the east at Dustbox 107/234, and from the east/northeast at Dustbox 145. Additional local sources such as construction sites (including demolition, on-site equipment and wind-blown dust), and industry would add to and exacerbate elevated pollution levels.
V. Actions
In relation to the evidence and findings from the Dustbox citizen monitoring study, preliminary actions are proposed here that take into account the neighbourhood context and existing community organisations and initiatives. The key areas for addressing air pollution include transport, construction, green infrastructure, and additional monitoring. These actions have been developed in consultation with monitoring participants and local area residents. Some actions are shared across the 7 data stories, while others are specific to this data story location:
Traffic and transport
- Building on the Lewisham Council Local Implementation Plan, develop a traffic management plan traffic for Deptford and New Cross in order to identify areas to improve pedestrian, cycle and public transport routes, and to understand the potential impact of the Ultra Low Emission Zone (ULEZ) on the area. Address the impact of new development and increasing population in the area, with a realistic projection of the likely numbers of new cars that will be in the area.
- Encourage the use of the River Thames as an alternative transport route for goods, construction and commuters and to reduce road traffic. However, require diesel-free or clean ship fuel to be used by vessels on the River Thames.
- Encourage and support transportation pilots to trial improved roadway design and circulation.
- Improve cycling opportunities in the area, and separate vehicle traffic from cycling traffic, including through the use of car-free green corridors.
- Post signs to encourage no idling. Signs that read ‘Turn your engine off’ and include images of people in pollution masks are more effective than text-only signs that read ‘No idling’.
- Encourage hybrid vehicles and busses, and investigate ways to integrate solar panels into the design of buses and bus stops. Allow for electric vehicle charging points to be requested by residents as part of community transport initiatives, and not only by those who own an electric vehicle.
Construction and development
- Ensure the fulfillment of Air Quality Impact Assessments (AQIAs), both at the planning and implementation stage of new developments, in order to accurately gauge the effect of construction with new developments. Develop adequate monitoring and compliance mechanisms for possible breaches of AQIAs.
- Develop planning and regulatory mechanisms for addressing the accumulative effects from construction and new developments. Impacts from construction and new development can include air pollution from demolition and siteworks, traffic during construction, and higher densities of buildings, people and traffic from new developments. Require that all new developments are ‘air quality neutral’, and ensure transparent and legible processes are in place for ensuring neutrality.
- Join up traffic planning across existing and new developments to facilitate walking, cycling and public transport. Design for neighbourliness with pedestrianized and play streets.
- Encourage cross-borough collaboration on construction and new development. Pending developments at the edge of Deptford, including the Silvertown Tunnel, the Enderby Wharf cruise ferry terminal, the Knight Dragon development at North Greenwich peninsula, and the Royal Docks Enterprise Zone could have a considerable effect on traffic in the area, especially along Evelyn Street.
- Include plans for managing construction traffic as part of providing planning approval for new developments. Ensure that construction traffic does not exceed set levels so as to avoid additional local pollution events.
- Address and prevent the loss of green space and public space due to new development. Green spaces can have a significant mitigating effect on air quality, and also provide a lower emission space in which people can spend time outdoors.
- Provide indicators for how to measure the effectiveness of dust measurement plans and practices at construction sites. Working with the London Low Emission Construction Partnership, provide mechanisms for enforcing dust management plans when they are not adhered to, and for reporting violations.
Green infrastructure
- Require an audit of green spaces in the borough, including an assessment of the suitability of green space as green infrastructure in relation to air pollution mitigation, and in relation to improving walkability and cycleability. Using existing London tree mapping resources, develop a tree plan for planting in the borough, and in relation to best guidance for trees suitable for minimising and lowering air pollution.
- Plant trees and preserve green spaces in relation to air quality guidance for vegetation.
- Investigate opportunities for planting air quality enhancing vegetation in existing neighbourhood green spaces, as well as at schools, hospitals, playgrounds and key community sites.
- Link with groups such as Voice4Deptford, Sayes Court, Deptford Folk and the Evelyn Assembly to identify opportunities for improving the local environment.
- Provide guidance on planting for air quality, including preferred species, optimal planting arrangements, and best practices for maintenance.
- Host air pollution monitoring and awareness events in green spaces to raise awareness about the importance of urban design and planning in relation to mitigating and prevent air pollution.
Air quality monitoring
- Prioritise air-quality audits of emission levels at Deptford and New Cross schools, in line with the Mayor of London’s initiative. Expand and provide courses in schools for children to learn about air quality and to undertake air quality monitoring in their local area, including promoting actions for reducing air pollution such as walking to school.
- Provide resources for community organisations and residents to continue to monitor air quality over time in order to assess improvements from preventative and mitigating actions.
- Provide resources to undertake speciation to understand the composition and sources of particulate matter, including from roads, construction and other sources.
- Develop protocols and channels for citizens to provide monitoring data to local and GLA environmental health and planning officers, and require officers to act on identified exceedances in relation to air quality guidelines.
Acknowledgements
The Citizen Sense project is led by Professor Jennifer Gabrys. These data stories were developed working in collaboration with Helen Pritchard and Dr Lara Houston. Thanks are due to our collaborators including:
Dr Benjamin Barratt and Khadija Jabeen at the Environmental Research Group, King’s College, University of London contributed to co-location and calibration of the Dustboxes, and Dr Barratt contributed to the analysis of the data stories.
Lau Thiam Kok contributed to the co-development of the Citizen Sense Airsift Data Analysis Toolkits, using and adapting openair software developed by Dr David Carslaw.
Raphael Faeh contributed to the digital design and layout of the “Pollution Sensing” data stories, which provided a model for these “Urban Sensing” data stories.
The Citizen Sense Dustbox included contributions to the printed circuit board design, which was developed in collaboration with Adrian McEwen of MCQN Ltd, and to the ceramic housing, which was rendered into 3D-printable format in collaboration with materials designer Francesca Perona.
Special thanks are due to the participants and residents in southeast London who contributed to the development and testing of the Dustbox monitoring kit, as well as to the collection and analysis of data, and communication of results to wider publics and regulators. For more information on project contributors, see Citizen Sense People.
These data stories are generated using the Citizen Sense Airsift Data Analysis Toolkit, which was developed to allow for citizen-led interpretation of datasets. The core data available for interpretation is the Dustbox PM2.5 sensor data. The Airsift toolkit also brings in air quality data from select sites in the London Air Quality Network (LAQN) for comparison with the citizen data.
In order to blur the exact monitoring locations, the monitoring locations are shown with large blue circles to indicate the approximate monitoring location. Additional citizen monitoring locations are anonymous, and are not included on the Airsift map.
At the start of the monitoring period, the Dustboxes were co-located with the Marylebone Atmospheric Observatory, and a scaling factor was applied to calibrate the devices. Because the sensors were co-located and calibrated during a time of low to moderate pollution, the scaling factor could slightly amplify higher readings in relation to the LAQN readings. However, this would require further testing to demonstrate, since when comparing Dustbox levels with nearby LAQN levels (where available), readings are often comparable.
This data story is prepared under the assumption that all pollutant, cartographic and meteorological measurements are valid and not sufficiently biased to cause misrepresentation of results. Please refer to the Airsift Data Analysis Toolkits and Terms of Use for further information.
The research leading to these results has received funding from the European Research Council under the European Union’s Seventh Framework Programme (FP/2007-2013) / ERC Grant Agreement n. 313347, “Citizen Sensing and Environmental Practice: Assessing Participatory Engagements with Environments through Sensor Technologies.”
To cite this data story, please use the reference: Citizen Sense (2017) “Pepys,” Deptford Data Stories, 14 November. Available at: https://datastories-deptford.citizensense.net/pepys.
This Pepys data story is also available to download as a PDF.