The Old Tidemill Garden area is nearby Deptford Church Street, and is a somewhat quieter area characterised by low-rise housing. The neighbourhood includes Deptford High Street, an important market area, as well as side streets used by pedestrians and cyclists. While there is some evidence of PM2.5 emissions related to traffic, pollution levels are somewhat lower here in comparison to neighbouring monitoring areas. Green spaces could have a mitigating effect on some PM2.5 levels, which warrants further study.
This data story details below how citizen data, weather data and local observations reveal these specific pollution patterns. Drawing on workshops with local residents, the data story also suggests how best to address the problem, from preserving and enhancing green space to planning for improved transport, and reducing emissions from ongoing construction activities.
I. The Location
The Old Tidemill Wildlife Garden is a mature green space and community garden managed by local residents. It sits on the former grounds of Old Tidemill School, a site earmarked by Lewisham Council for redevelopment into over 200 residential dwellings. As shown on the map below, Deptford Church street (A2209) is to the east of the site, and Evelyn Street (A200) is to the north of the site and New Cross Road (A2) is to the south of the site. Also to the east of the site is the DLR electric train track that runs from Deptford Bridge. Multiple sites to the northeast on Creekside are currently under construction. Three miles to the north east of the site is Blackwall Tunnel Southern approach and continuing towards the northeast is London City airport.
This data story compares a number of sites nearby the Old Tidemill Garden. Dustbox 103 is located on a fourth-floor walkway on a housing estate directly to the east of Deptford Church Street (A2209). Dustbox 109 is on Creekside, a quiet road that borders several construction sites. Dustbox 109 is located at the back of a large building, facing onto the Creek. Dustbox 138 is on a third-floor balcony on a housing development, facing onto the Creek and a small park. Dustbox 136/147 is to the west of Old Tidemill Wildlife Garden and placed on a third-floor covered balcony.(Dustbox 136/147 combines data from two Dustboxes as the first device was replaced mid-way through monitoring.)
Local sources of particulate pollution
The most immediate sources of particulate pollution are the extensive arterial road networks that surround the garden. As the map above shows, Deptford Church Street (A2209) is adjacent to the garden and is a potential source of local pollution to the east. New Cross Road (A2) is south of the garden running from west to southeast. Two smaller roads north of the garden – Frankham Street and Giffin Street – have been regularly monitored by citizens due to a heavy traffic load. Results from a diffusion tube monitoring study conducted in 2014 are available on a community map. This study shows elevated levels of nitrogen dioxide (NO2) at major roadways in the area.
London-wide, regional and global sources of particulate pollution
Particulate matter sources in London can be attributed to a broad range of emissions. Within London, PM2.5 from transport (particularly diesel), industry, construction, cooking and heating all contribute significantly to London-wide levels. A significant amount of PM2.5 emissions also comes from heavy industry and agriculture outside the UK, particularly France, Belgium, the Netherlands, Luxembourg, Germany and Poland. These emissions are thought to account for an urban background of approximately 10 µg/m3. The importance of these transboundary effects of PM2.5 emissions from outside of the UK on the total London PM2.5 can vary between 40% to 80% daily depending on weather conditions. When long-range pollution episodes do occur in London, they are generally carried on easterly winds. There are a number of global emissions, events and practices that contribute particulate matter to the total London PM2.5, including fuel production, industrial and domestic combustion, transportation, waste disposal, and agriculture, although these are harder to quantify.
Observations
Residents report idling traffic on Deptford Church Street and New Cross Road. Participants have reported that traffic starts around 5 am with lorries coming in and continuing all day until around 7 pm. Participants have also noted that when the Blackwall Tunnel is closed the traffic is often diverted through Deptford Church Street. During some of the monitoring period, Deptford Church Street was reduced from four to two lanes due to construction and road works. The Deptford High Street to the west of the site is generally a lower traffic area except for mornings and afternoons on Wednesday, Friday and Saturday, during which time the market is set up and taken down. The A200 to the north of the site is also often congested, however, due to traffic zoning there are no HGVs on this route.
Residents also have noted idling delivery trucks, visible dust and noise from the construction sites on Creekside, where active construction sites could be emitting dust from on-site work, in addition to possible emissions from the use of non-road machinery and vehicle movements to and from sites. A citizen map documents these emission sources in the Creekside data story.
II. Is there evidence of a problem?
The Dustbox device used to monitor PM2.5 is an “indicative” monitor. This means that measurements can give an indication of pollutant concentrations, but cannot be directly compared with national and international guidelines and standards in an “official” or regulatory sense. Despite this, indicative monitoring is a well-established method within atmospheric science for carrying out initial surveys of an area to establish whether a potential problem merits further investigation. Indicative monitors are also becoming increasingly available for citizen-based air-quality monitoring, similar to this study.
Where possible, the Dustboxes were co-located at the start and the end of the study to account for differences in the sensors and drift during the monitoring period. The co-location of Dustboxes in this data story indicates that there is a good similarity in measurements across the monitors used in this monitoring location, as well as with monitors in the extended community network, both at the start and end of the monitoring period.

Indicative daily mean concentrations of PM2.5 are shown as a time-series chart in Figure 1. The World Health Organisation (WHO) guideline of 25 µg/m3 for 24-hour daily mean concentration of PM2.5 is exceeded on a number of occasions at Dustbox 109, and this pattern is repeated at the surrounding Dustboxes, suggesting that further investigation may be warranted. However, it is important to determine whether these breaches were caused by “local” sources of pollution close to the sensor (i.e., within 300 meters), or by regional sources affecting the whole area.
Local sources often augment regional sources, which can be revealed as a spike on top of a hump. In a general sense, this regional-local pattern occurs because pollution mixes in the atmosphere as it travels away from a source, smoothing the speed of changes in concentrations.
Figure 1 shows an extract of the monitoring data from the Dustbox 109 and 136 sites presented as 24-hourly mean concentrations of PM2.5. Regional sources of pollution appear as broad “humps” of elevated pollution. Local sources of pollution appear as short “spikes” typically affecting only one or the other site, for example, from 20 to 25 January 2017 at the Dustbox 109 site (but not at Dustbox 136 at the same time).
Figure 1 therefore indicates that there could be significant local sources of particulate pollution elevating ambient concentrations well above those caused by regional sources across the monitoring period.
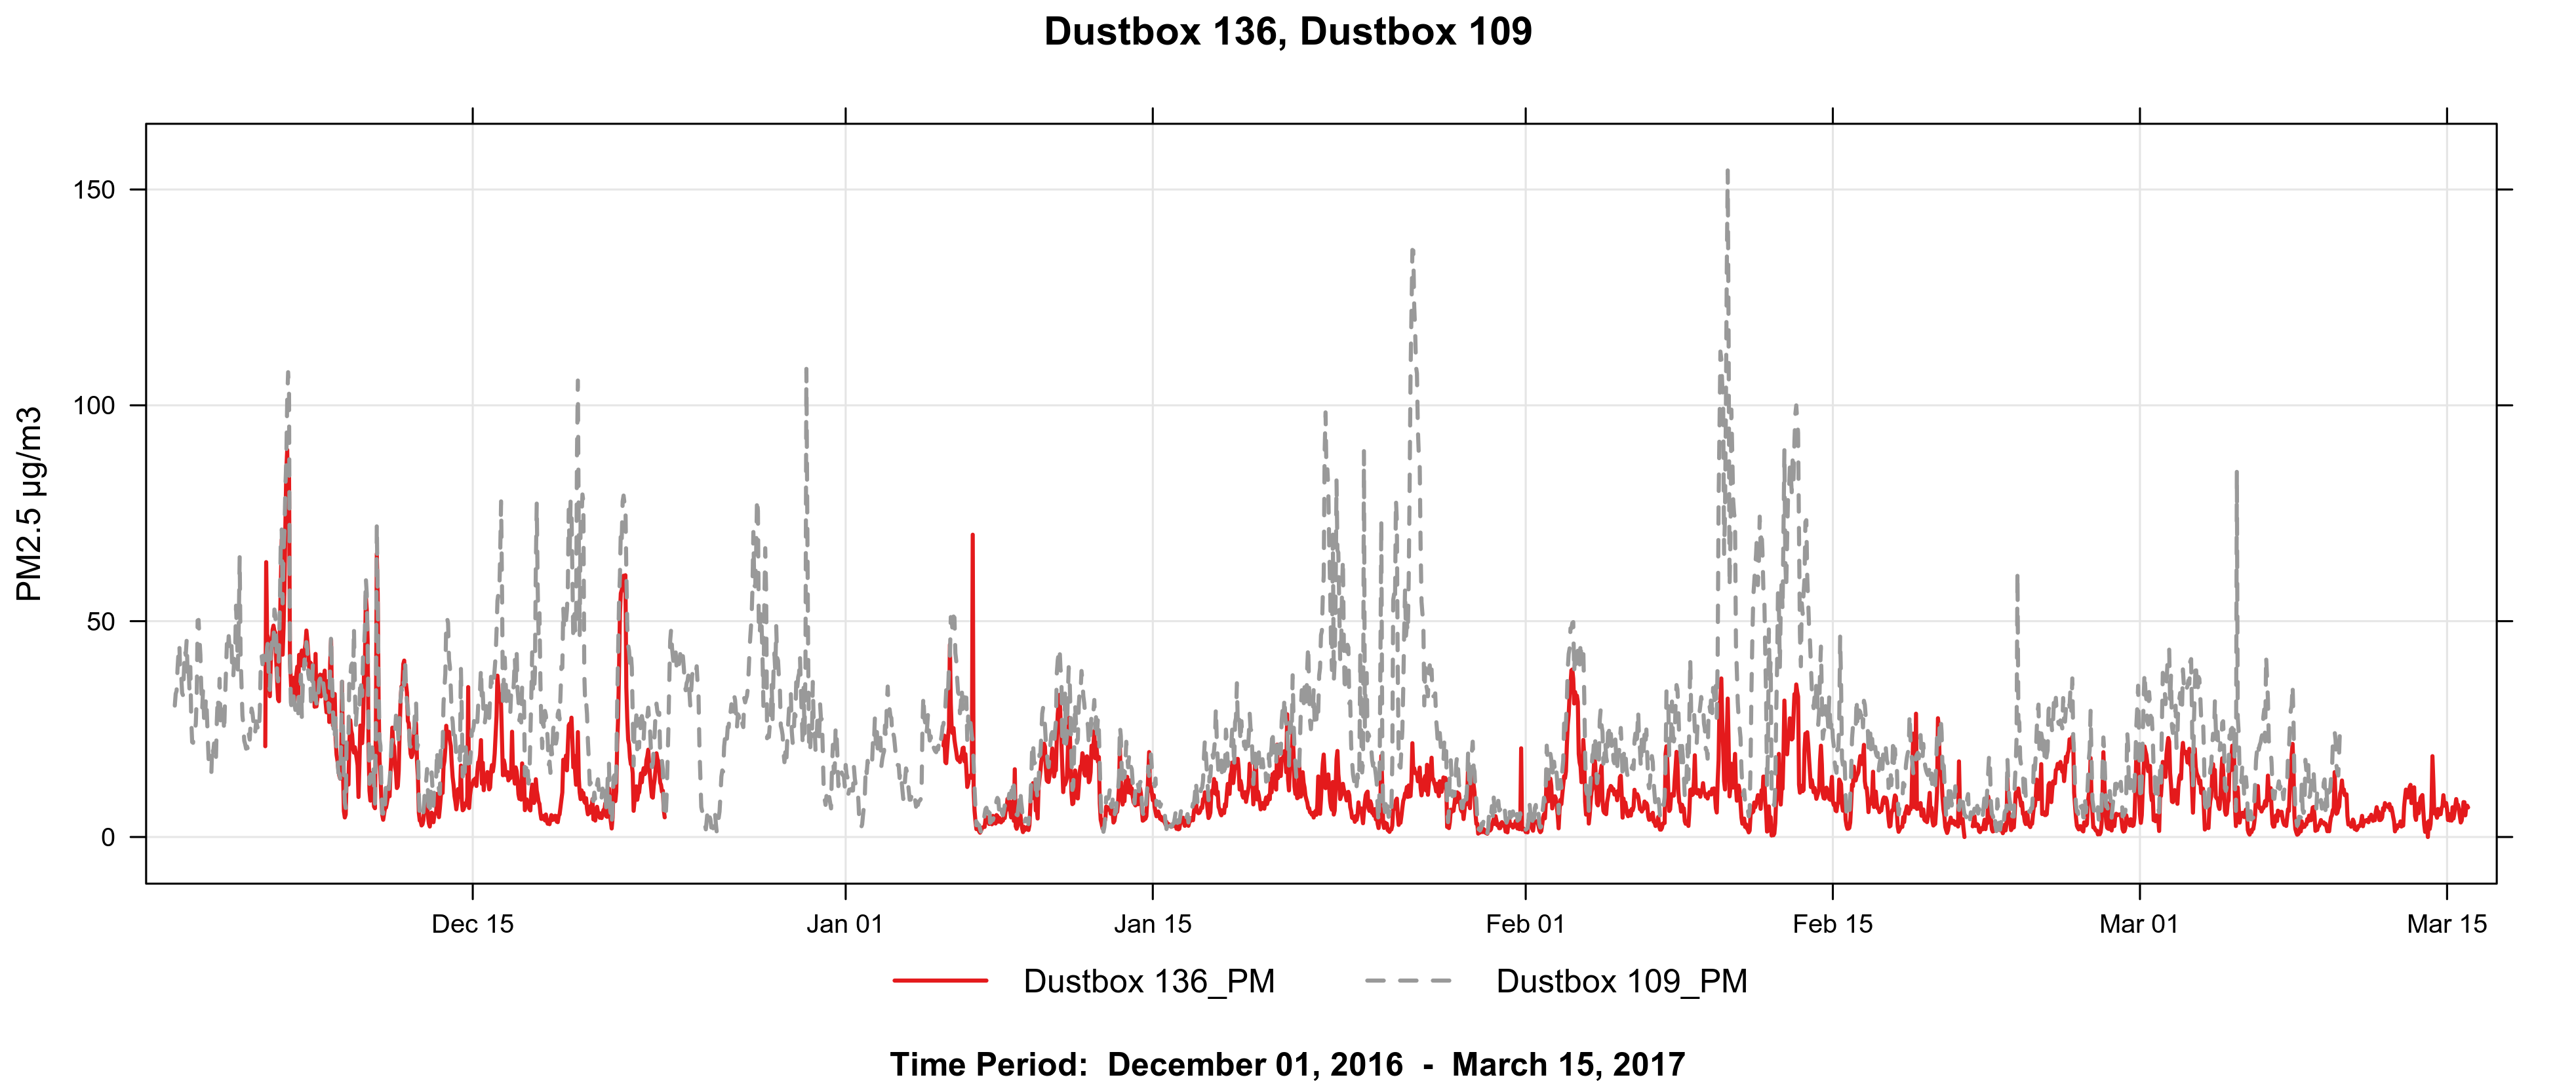
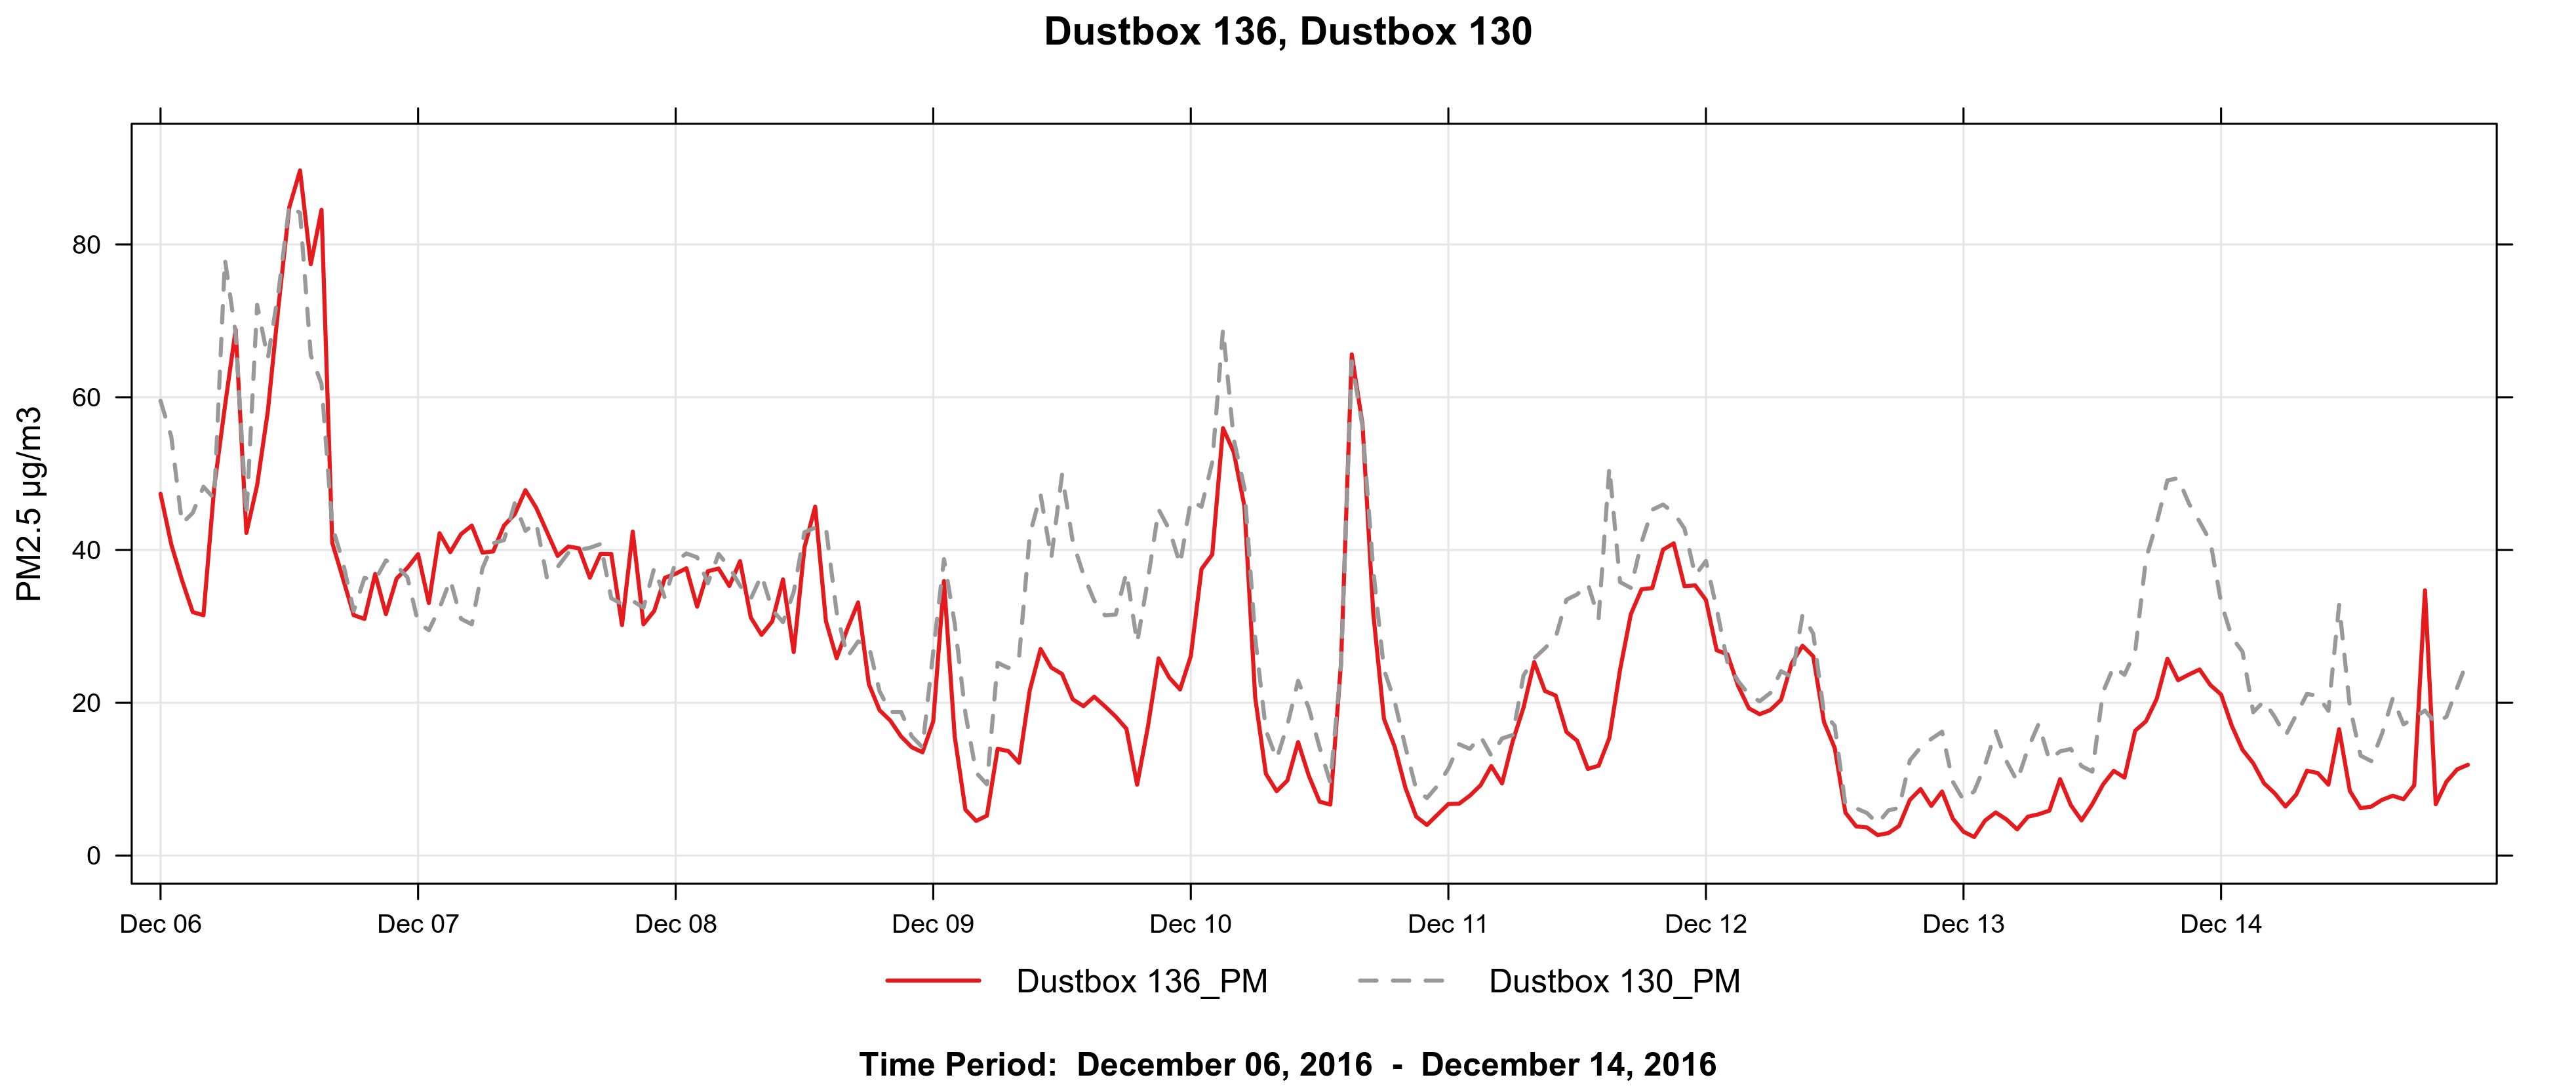
Figure 2a shows an extract of the monitoring data from the Dustbox 136 site presented as 1-hour mean concentrations of PM2.5. Measurements from Dustbox 109 are shown for comparison. Regional sources of pollution appear as broad “humps” of elevated pollution affecting both sites. Local sources of pollution appear as short “spikes” typically affecting only one or the other site. In general, Dustbox 136 indicates city-wide pollution levels, while Dustbox 109 provides evidence of more localized pollution sources. Figure 2b shows an extract of data from Dustbox 136 and Dustbox 130 from comparison, as the both these monitors show a similar pattern it is likely they also share local emission sources.
Figures 2a and 2b therefore indicate that there are significant local sources of particulate pollution elevating ambient concentrations well above those caused by regional sources across the monitoring period, particularly at the Dustbox 109 location.
There are many possible sources of pollution in the area and we have to look at the measurements more closely to see if we can deduce what activities are causing these spikes. Knowing the source of pollution is important as some activities produce more toxic particulate matter than others, and actions to mitigate sources should be targeted to the cause of the problem.
III. Characterizing the problem
When is the source most evident?
Using time plots, it is possible to analyse time of day and day of week, as well as month, when pollution levels are elevated. Time plots aggregate PM2.5 concentrations according to time, so that key patterns such as rush hours and traffic, as well as possible construction or industry sources, along with regional pollution events due to seasonal variation, are evident.
Enlarge

Enlarge

Figures 3 and 4 investigate when elevated levels in pollution occur by grouping concentrations by hour, month and day of the week. Sources of pollution related to commuter or transit traffic typically show peaks in concentrations coincidental with peaks in traffic flow, i.e., morning and evening rush hour with notably lower levels at night and on Sundays. This can also be seen in Figures 3 and 4, where there is evidence of early morning and evening peaks. However it is clear the morning peaks are around 5 to 6 am, perhaps suggesting higher levels of particulates from earlier traffic, such as deliveries and construction crews.
These charts can be used to match patterns in the occurrence of spikes with working patterns of particulate-generating activities in the area. Figure 4 shows that on most days there are elevated levels in the early hours of the morning and from midday to 6 pm at the Dustbox 109 site. Levels are lowest on Sundays at both sites, suggesting weekday activity due to road traffic and construction as possible emissions sources.
In a general sense, it should be noted that the weather plays a large role in particulate levels. For example, dust tends to be dispersed more slowly during the hours of darkness, as vertical and horizontal wind speeds are generally lower. This phenomenon may skew charts somewhat.
Which direction is PM2.5 coming from?
Wind direction has a considerable influence on pollution measurements. A sensor will only record emissions from a particular source or activity if the wind blows it from the source towards the sensor. Therefore, we can investigate where a source of pollution is likely to be located by plotting wind direction against pollution concentrations.
Enlarge
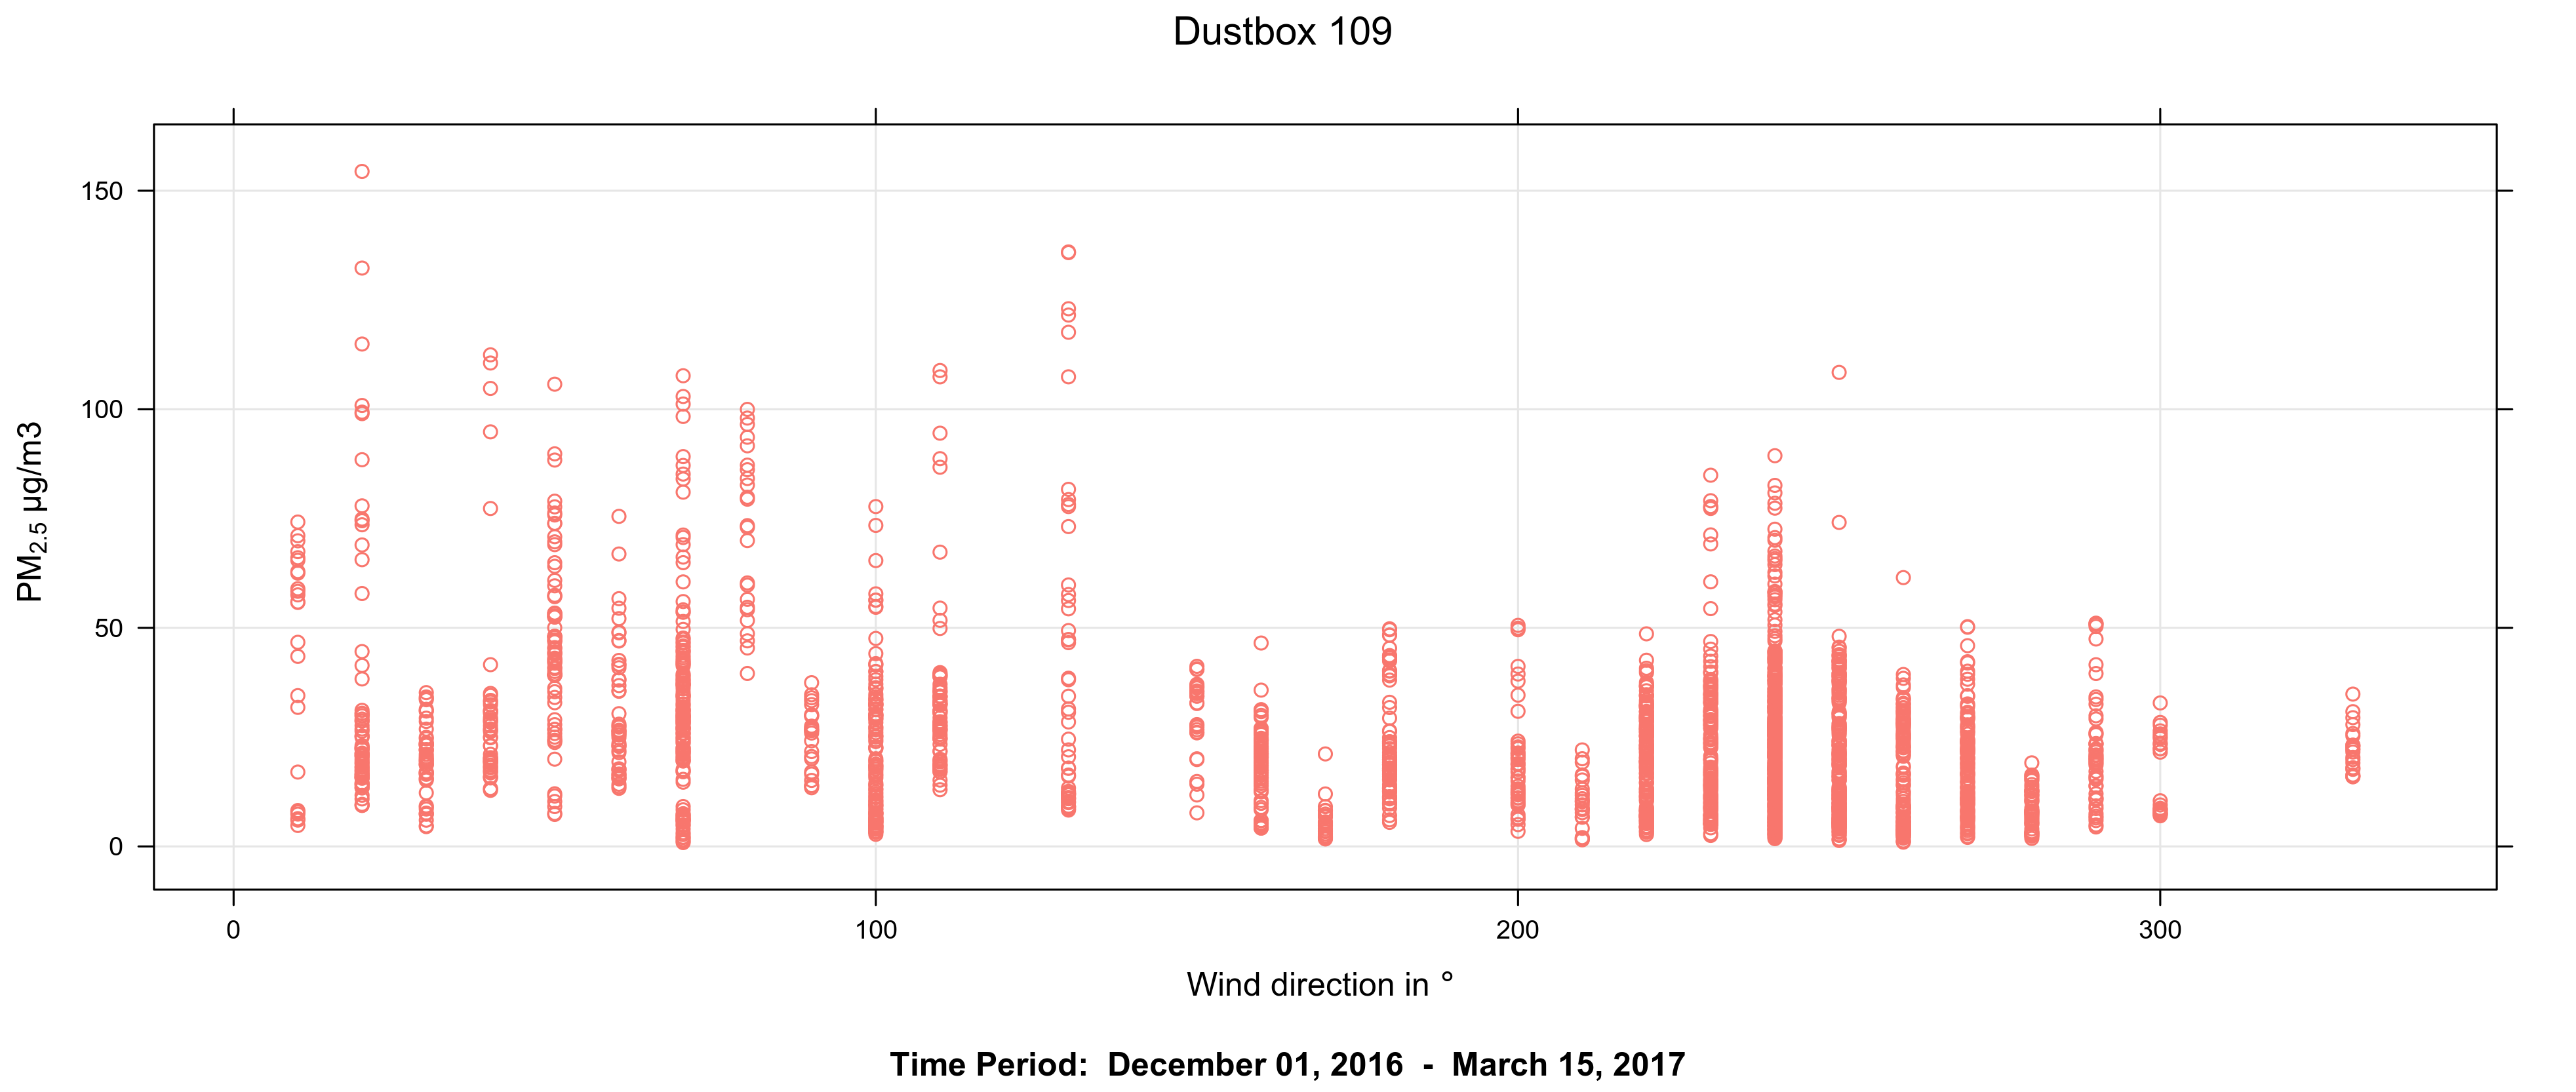
Figure 5 shows how pollutant concentrations at the Dustbox 109 site are influenced by wind direction. It is clear that higher but somewhat less frequent peaks are recorded when the wind blows from the southwest (220O to 240O), and the highest more frequent peaks occur when the wind blows from the from the north to the southeast (10O to 110O).
A polar plot, as shown in the figure below, is a more intuitive way of looking at this relationship. This shows colour contours of pollutant concentrations in relation to wind direction and wind speed (zero wind in the centre, increasing up to 20 ms-1 at the outer ring). The highest mean concentrations are shown in red, and the lowest are in blue
Enlarge
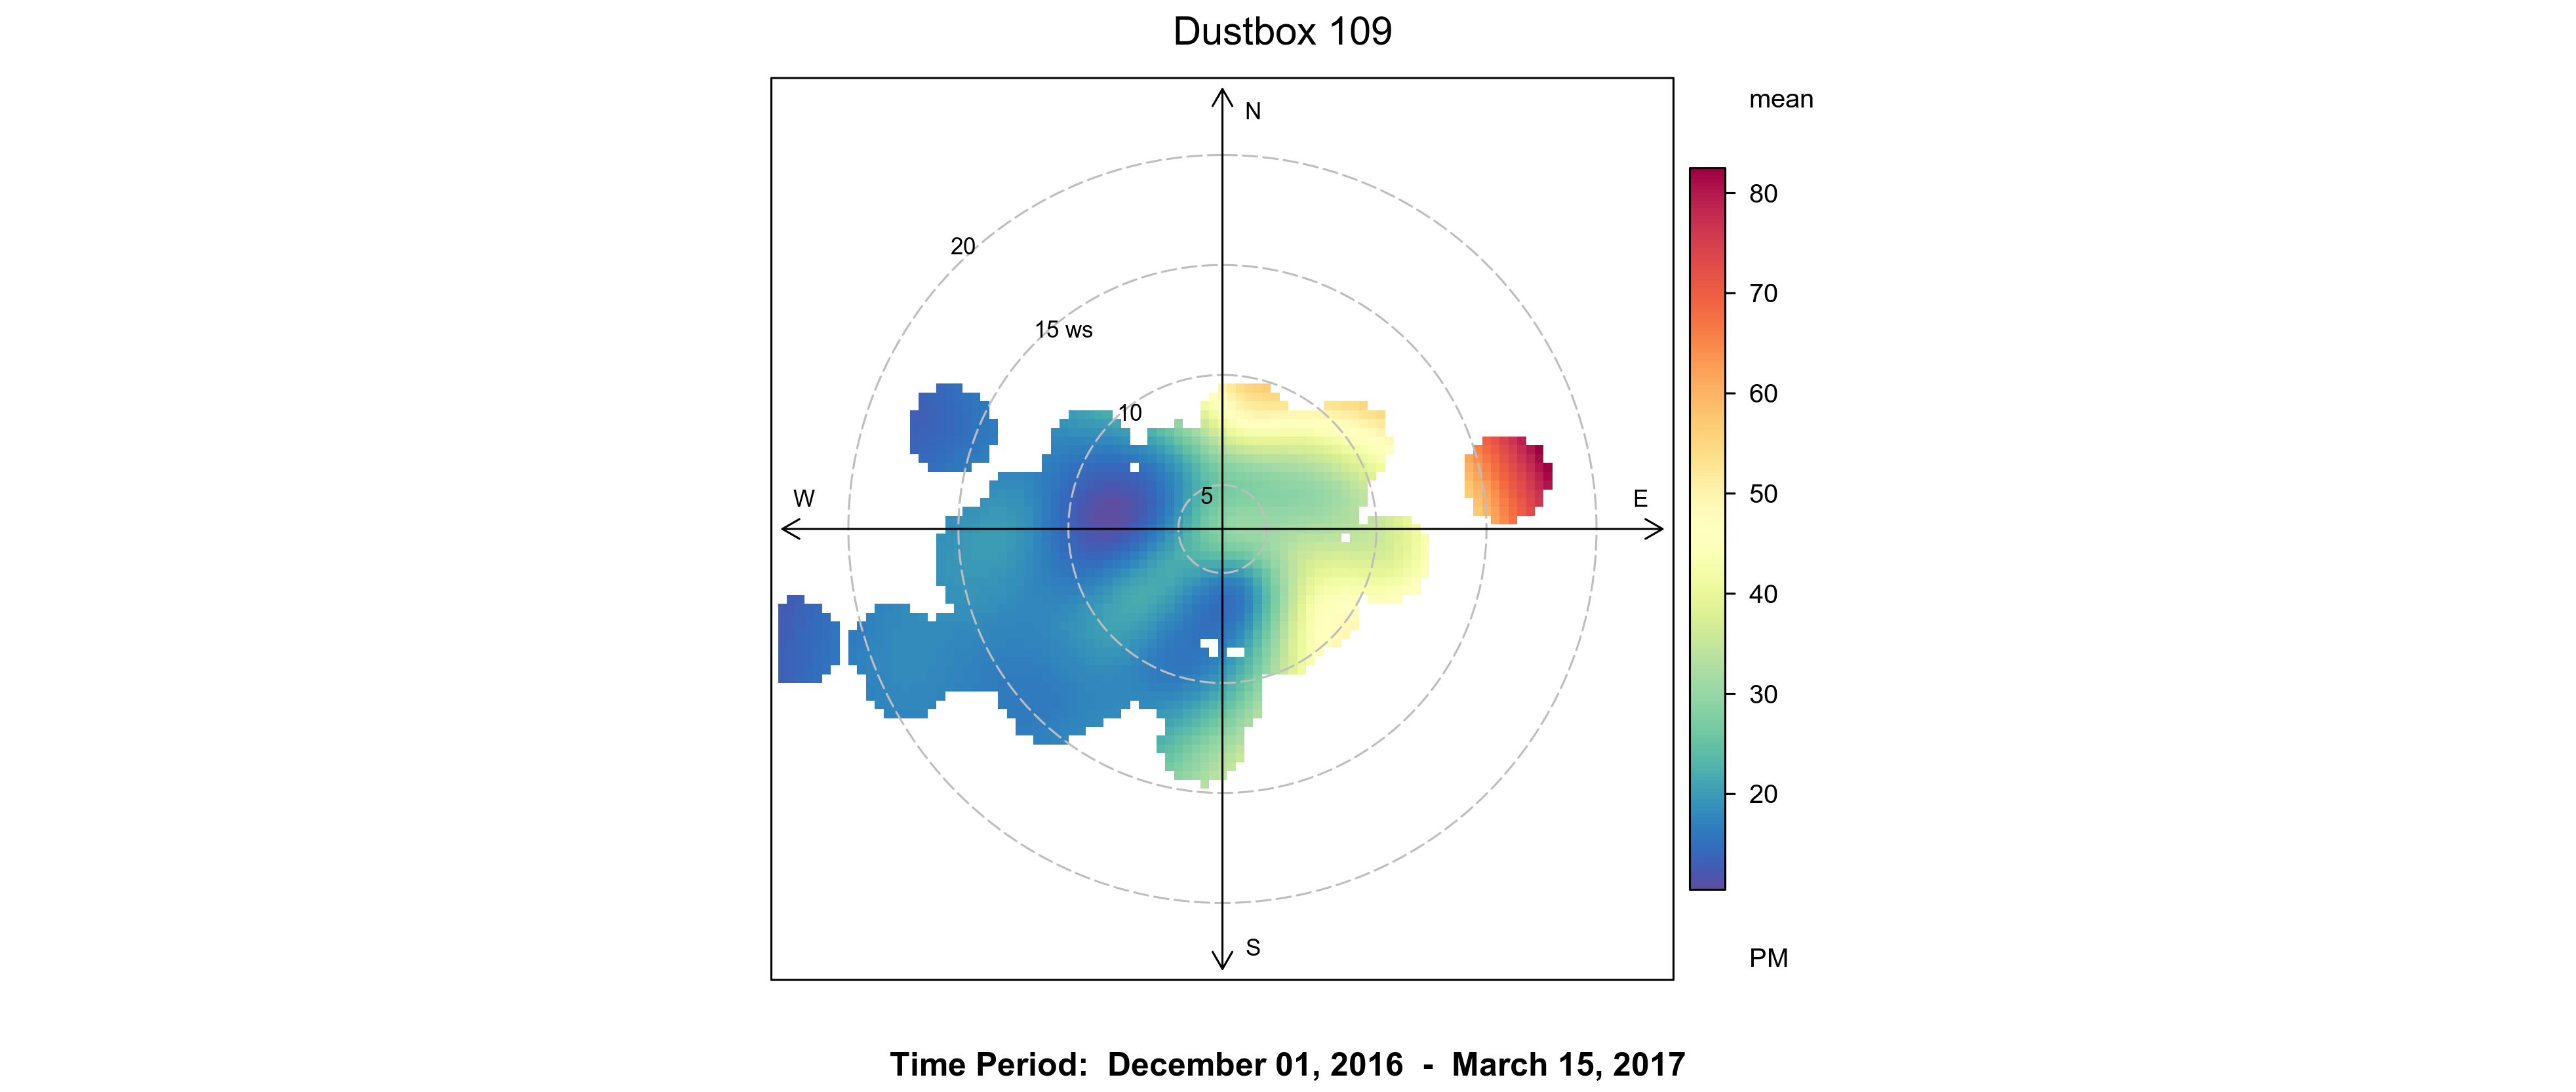
In common with Figure 5, Figure 6a highlights the fact that, on average, the most frequent high levels of pollution are recorded at the Dustbox site 109 during northeasterly winds (this is also evident in the nearby Dustbox 103 site). In contrast, there is clearly a source of pollution to the southwest of the Dustbox 136 site that is not as evident at the Dustbox 109 site. As all sites show a source to the east, there may be a regional source of air pollution in that direction, which is detected by most sensors in the area.
Enlarge
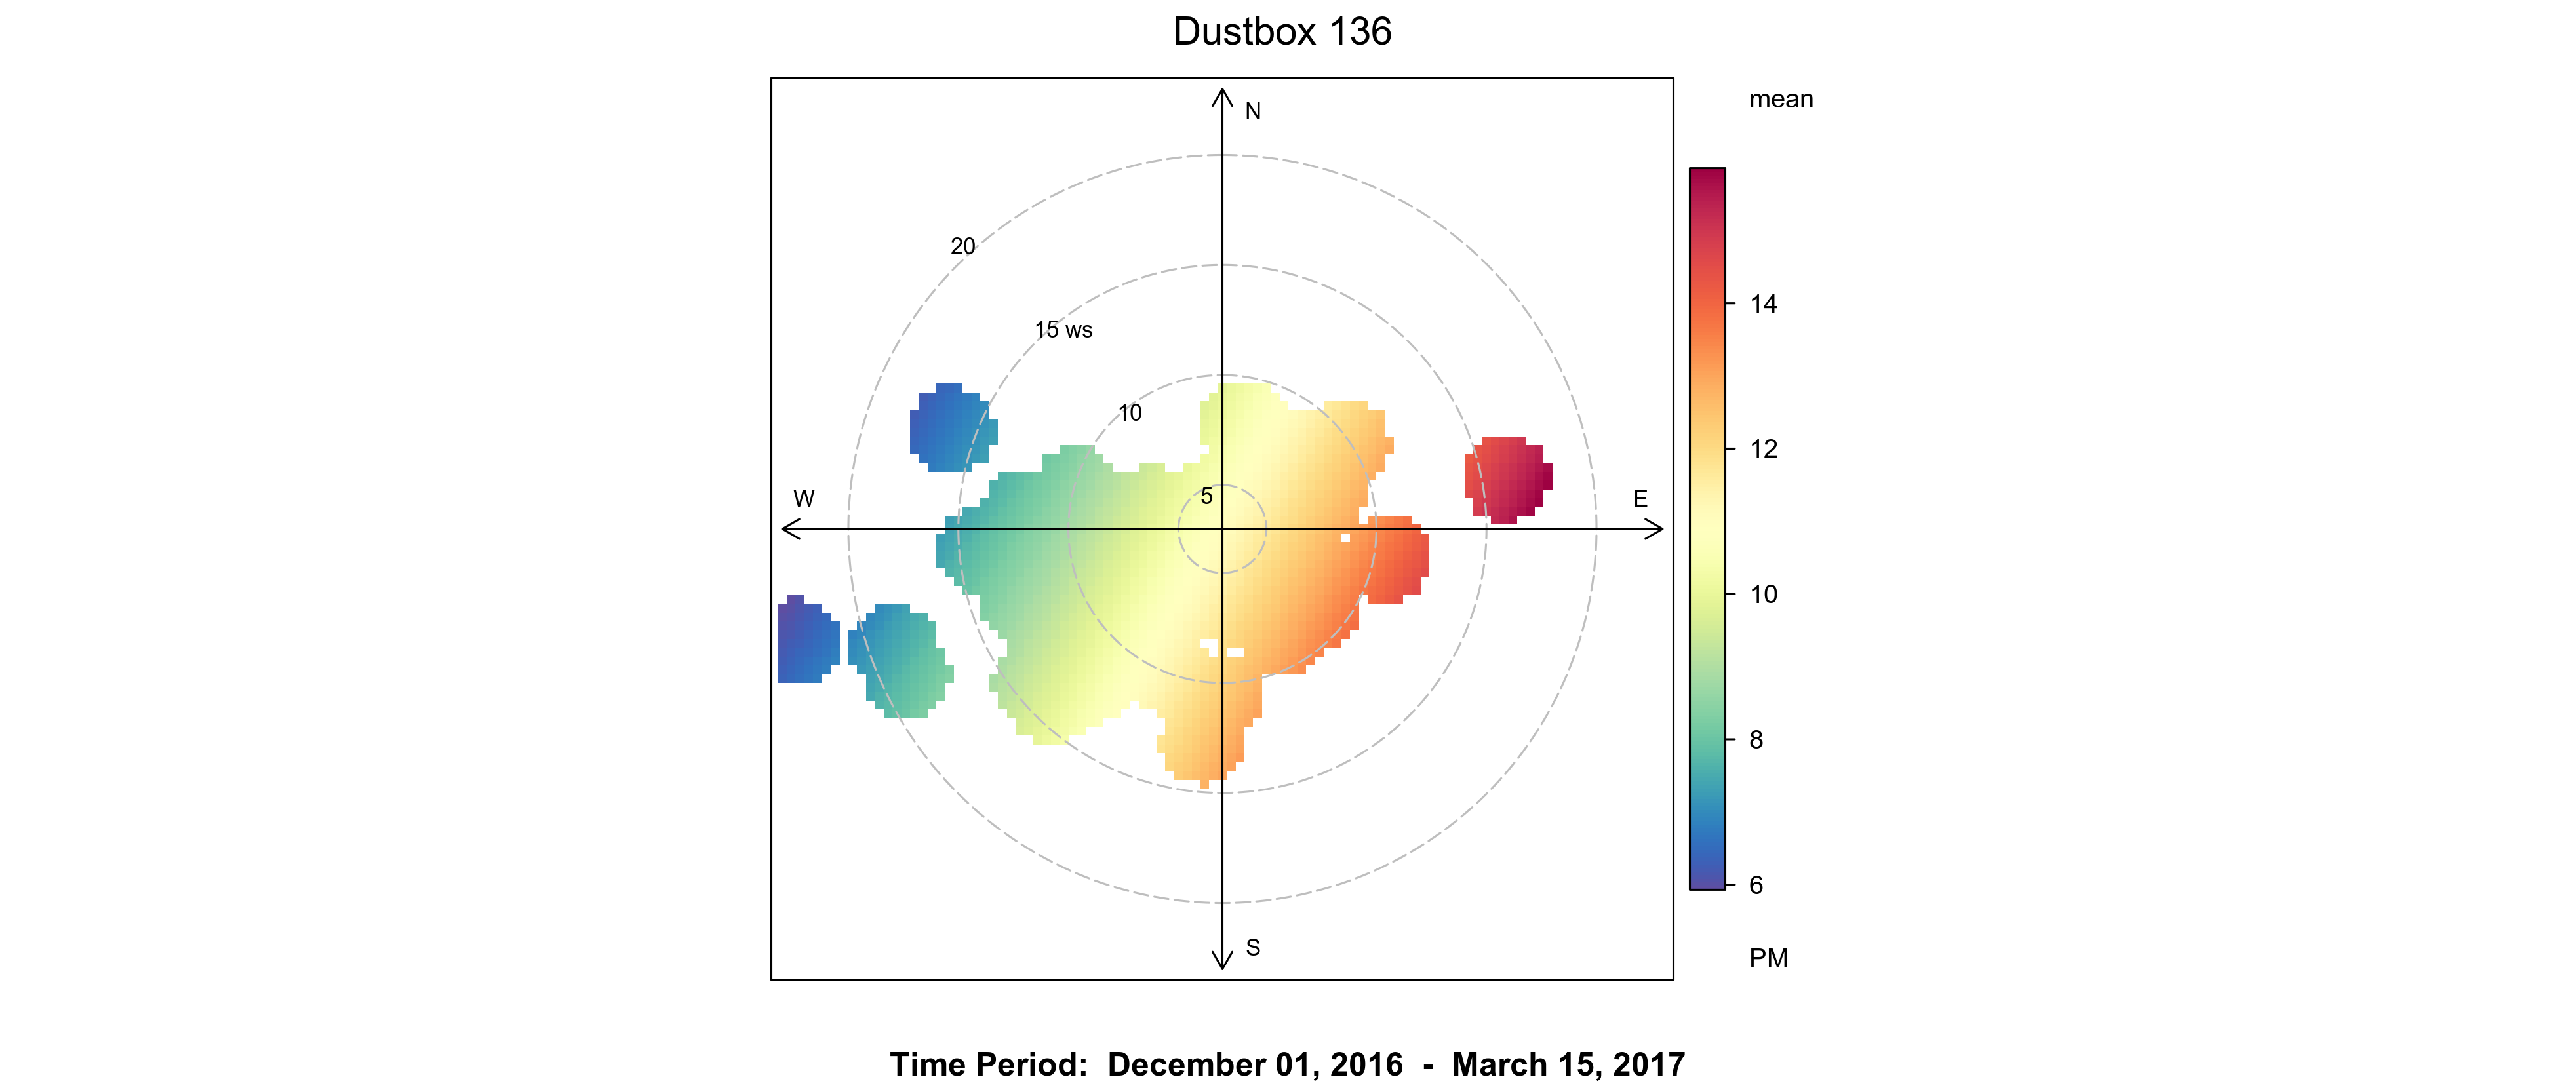
In addition, although Figure 6b shows higher concentrations during northeasterly winds, pollution levels are significantly lower at Dustbox 136 in comparison to Dustbox 109.
Under which weather conditions are PM2.5 levels most evident?
Different sources of pollution will behave in distinct ways according to the weather. For example, windblown dust will primarily occur during dry, windy conditions. Sometimes, you can learn about a source by characterizing this weather-related behaviour.
Enlarge
Enlarge

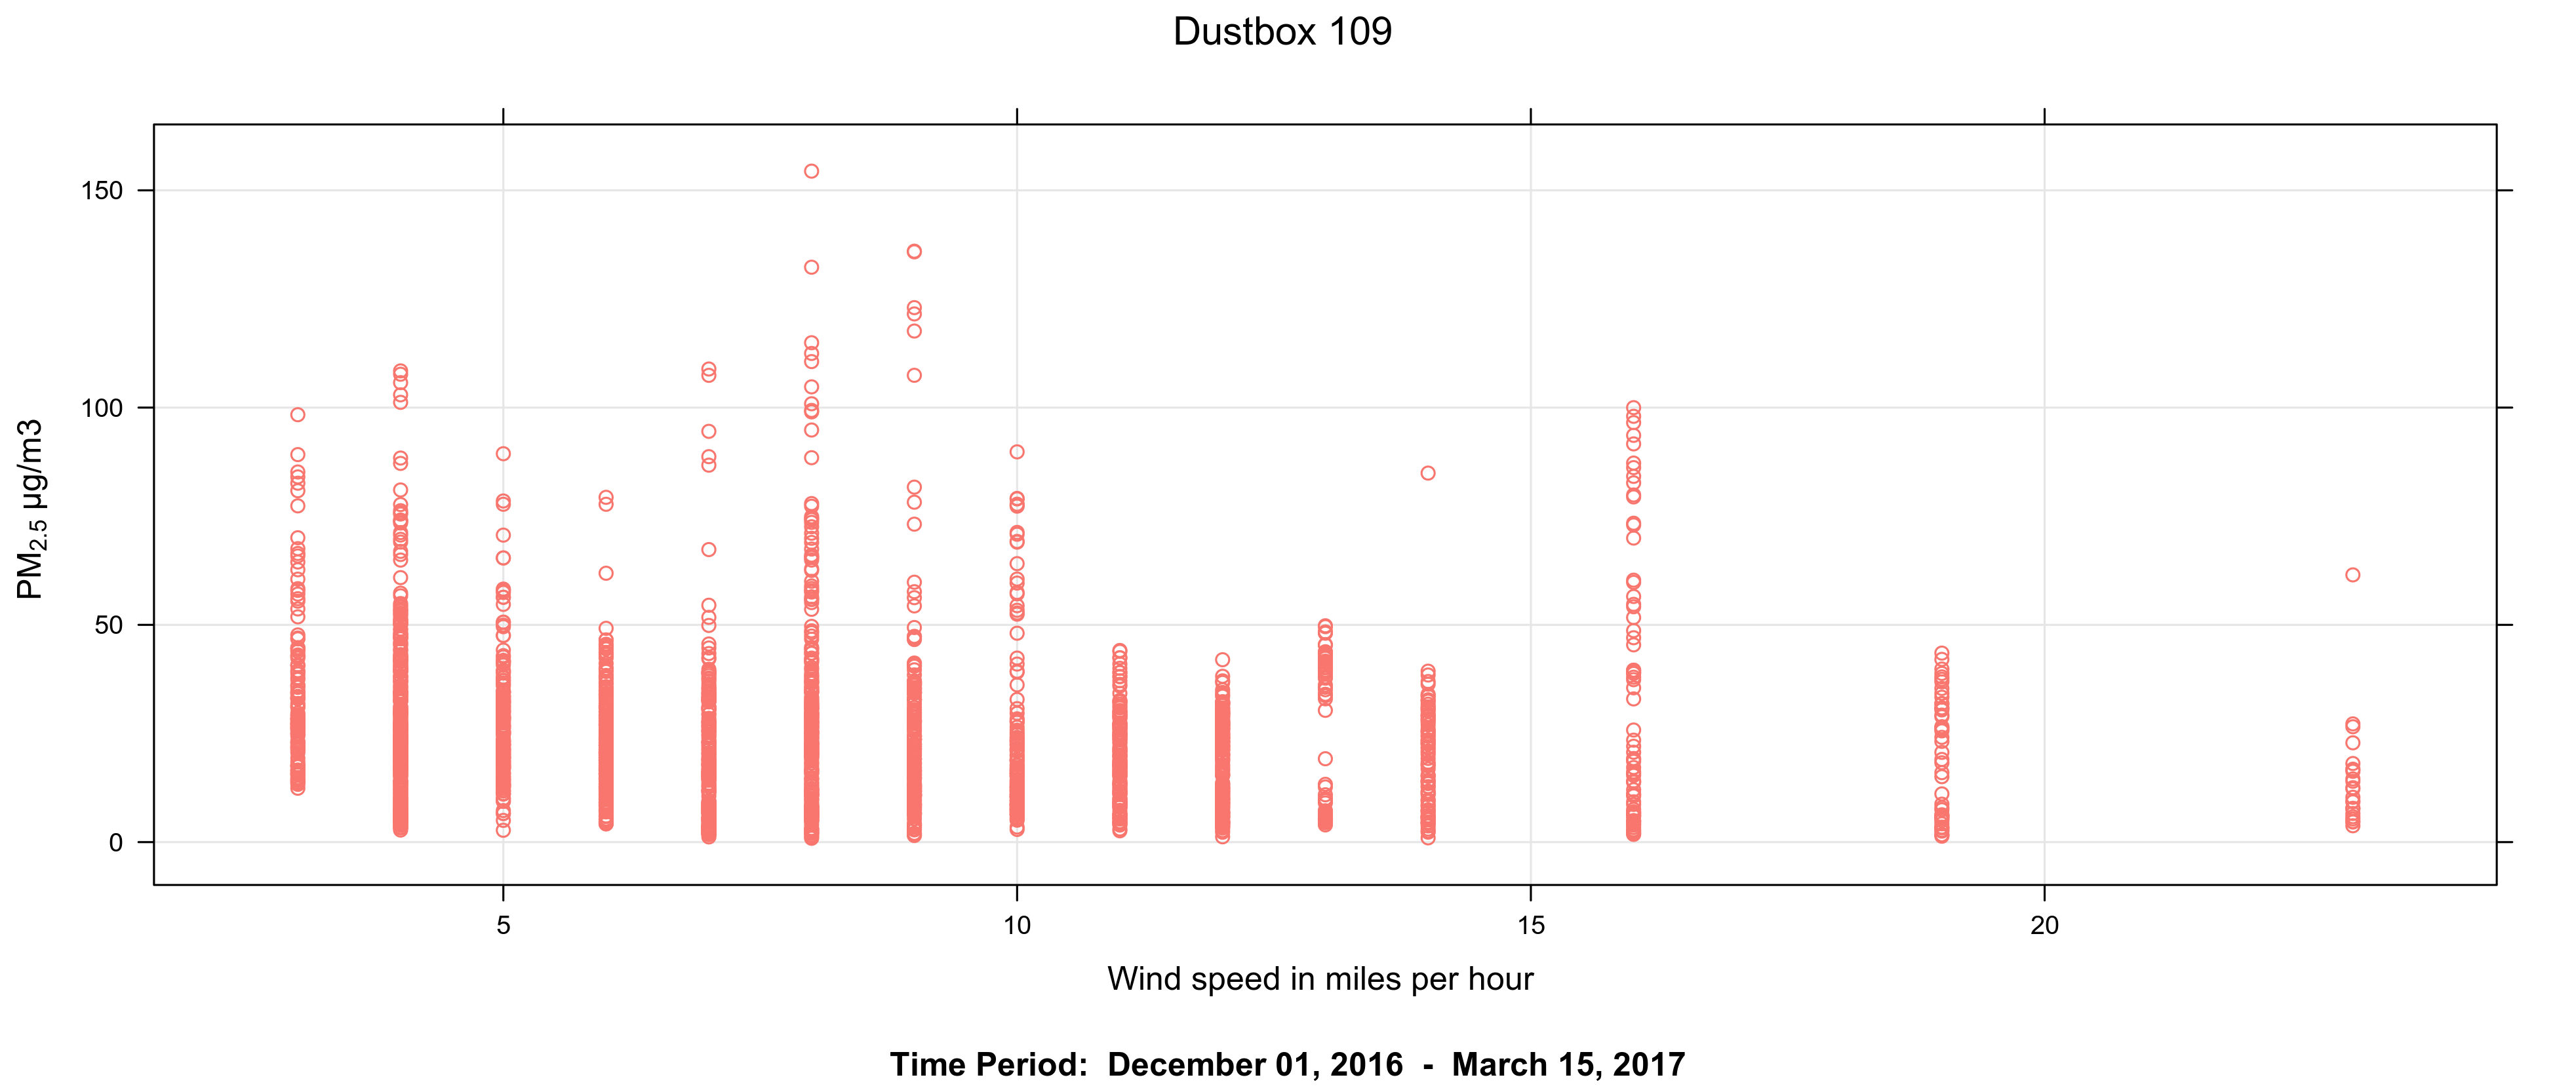
The relationship between particulate pollution concentrations and wind speed is shown in Figure 7. This figure suggests that the main source of PM2.5 at the Dustbox 109 site is not wind-blown dust, as the majority of peak concentrations are recorded during lower wind speeds. This conclusion is supported by Figure 8, which shows that the highest hourly PM2.5 levels were recorded during relatively humid conditions (around 55% to 90% humidity). During high humidity, there would be fewer occurrences of wind-blown dust.
IV. Drawing the evidence together
Using the tools provided through the Citizen Sense Airsift Dustbox Data Analysis Toolkit, we have characterized sources of particulate pollution detected by the Dustbox 109 and Dustbox 136 sensors as follows:
- While regional sources of pollution were detected, there was clear evidence of additional local source or sources.
- The strongest local source(s) appear to be to the northeast of the Dustbox 109 site, and to the northeast, northwest and southwest of the Dustbox 136 site. Looking at all other local sites and industries capable of generating PM2.5 it is possible that traffic on the major roadways, including Deptford Church Street and New Cross Road, along with construction dust on Creekside and high levels of construction in the east in general could all be responsible for emissions.
- The local source is strongest during the early hours before 6 am, and the afternoon/early evening. It is therefore also likely to be related to delivery, construction and commuter road traffic.
- PM2.5 levels for this monitoring period are unlikely to be related to re-suspended or wind-blown dust due to the low wind speeds and higher humidity levels at which higher concentrations occur.
- As Dustbox 136 receives much lower emissions in general from the northeast, and Dustbox 109 receives lower emissions from the southwest, it could be possible that the Old Tidemill Wildlife Garden located between the two sites has a mitigating effect on air pollution. Further monitoring on-site and at the boundary of the garden would help to establish the differences in pollution levels in relation to the garden.
V. Actions
In relation to the evidence and findings from the Dustbox citizen monitoring study, preliminary actions are proposed here that take into account the neighbourhood context and existing community organisations and initiatives. The key areas for addressing air pollution include transport, construction, green infrastructure, and additional monitoring. These actions have been developed in consultation with monitoring participants and local area residents. Some actions are shared across the 7 data stories, while others are specific to this data story location:
Traffic and transport
- Building on the Lewisham Council Local Implementation Plan, develop a traffic management plan traffic for Deptford and New Cross in order to identify areas to improve pedestrian, cycle and public transport routes, and to understand the potential impact of the Ultra Low Emission Zone (ULEZ) on the area. Address the impact of new development and increasing population in the area, with a realistic projection of the likely numbers of new cars that will be in the area.
- Encourage the use of the River Thames as an alternative transport route for goods, construction and commuters and to reduce road traffic. However, require diesel-free or clean ship fuel to be used by vessels on the River Thames.
- Encourage and support transportation pilots to trial improved roadway design and circulation.
- Improve cycling opportunities in the area, and separate vehicle traffic from cycling traffic, including through the use of car-free green corridors.
- Post signs to encourage no idling. Signs that read ‘Turn your engine off’ and include images of people in pollution masks are more effective than text-only signs that read ‘No idling’.
- Encourage hybrid vehicles and busses, and investigate ways to integrate solar panels into the design of buses and bus stops. Allow for electric vehicle charging points to be requested by residents as part of community transport initiatives, and not only by those who own an electric vehicle.
Construction and development
- Ensure the fulfillment of Air Quality Impact Assessments (AQIAs), both at the planning and implementation stage of new developments, in order to accurately gauge the effect of construction with new developments. Develop adequate monitoring and compliance mechanisms for possible breaches of AQIAs.
- Develop planning and regulatory mechanisms for addressing the accumulative effects from construction and new developments. Impacts from construction and new development can include air pollution from demolition and siteworks, traffic during construction, and higher densities of buildings, people and traffic from new developments. Require that all new developments are ‘air quality neutral’, and ensure transparent and legible processes are in place for ensuring neutrality.
- Join up traffic planning across existing and new developments to facilitate walking, cycling and public transport. Design for neighbourliness with pedestrianized and play streets.
- Encourage cross-borough collaboration on construction and new development. Pending developments at the edge of Deptford, including the Silvertown Tunnel, the Enderby Wharf cruise ferry terminal, the Knight Dragon development at North Greenwich peninsula, and the Royal Docks Enterprise Zone could have a considerable effect on traffic in the area, especially along Evelyn Street.
- Include plans for managing construction traffic as part of providing planning approval for new developments. Ensure that construction traffic does not exceed set levels so as to avoid additional local pollution events.
- Address and prevent the loss of green space and public space due to new development. Green spaces can have a significant mitigating effect on air quality, and also provide a lower emission space in which people can spend time outdoors.
- Provide indicators for how to measure the effectiveness of dust measurement plans and practices at construction sites. Working with the London Low Emission Construction Partnership, provide mechanisms for enforcing dust management plans when they are not adhered to, and for reporting violations.
Green infrastructure
- Require an audit of green spaces in the borough, including an assessment of the suitability of green space as green infrastructure in relation to air pollution mitigation, and in relation to improving walkability and cycleability. Using existing London tree mapping resources, develop a tree plan for planting in the borough, and in relation to best guidance for trees suitable for minimising and lowering air pollution.
- Plant trees and preserve green spaces in relation to air quality guidance for vegetation.
- Investigate opportunities for planting air quality enhancing vegetation in existing neighbourhood green spaces, as well as at schools, hospitals, playgrounds and key community sites.
- Link with groups such as Deptford Neighbourhood Action to identify opportunities for improving the local environment.
- Provide guidance on planting for air quality, including preferred species, optimal planting arrangements, and best practices for maintenance.
- Host air pollution monitoring and awareness events in green spaces to raise awareness about the importance of urban design and planning in relation to mitigating and prevent air pollution.
Air quality monitoring
- Prioritise air-quality audits of emission levels at Deptford and New Cross schools, in line with the Mayor of London’s initiative. Expand and provide courses in schools for children to learn about air quality and to undertake air quality monitoring in their local area, including promoting actions for reducing air pollution such as walking to school.
- Provide resources for community organisations and residents to continue to monitor air quality over time in order to assess improvements from preventative and mitigating actions.
- Provide resources to undertake speciation to understand the composition and sources of particulate matter, including from roads, construction and other sources.
- Develop protocols and channels for citizens to provide monitoring data to local and GLA environmental health and planning officers, and require officers to act on identified exceedances in relation to air quality guidelines.
Acknowledgements
The Citizen Sense project is led by Professor Jennifer Gabrys. These data stories were developed working in collaboration with Helen Pritchard and Dr Lara Houston. Thanks are due to our collaborators including:
Dr Benjamin Barratt and Khadija Jabeen at the Environmental Research Group, King’s College, University of London contributed to co-location and calibration of the Dustboxes, and Dr Barratt contributed to the analysis of the data stories.
Lau Thiam Kok contributed to the co-development of the Citizen Sense Airsift Data Analysis Toolkits, using and adapting openair software developed by Dr David Carslaw.
Raphael Faeh contributed to the digital design and layout of the “Pollution Sensing” data stories, which provided a model for these “Urban Sensing” data stories.
The Citizen Sense Dustbox included contributions to the printed circuit board design, which was developed in collaboration with Adrian McEwen of MCQN Ltd, and to the ceramic housing, which was rendered into 3D-printable format in collaboration with materials designer Francesca Perona.
Special thanks are due to the participants and residents in southeast London who contributed to the development and testing of the Dustbox monitoring kit, as well as to the collection and analysis of data, and communication of results to wider publics and regulators. For more information on project contributors, see Citizen Sense People.
These data stories are generated using the Citizen Sense Airsift Data Analysis Toolkit, which was developed to allow for citizen-led interpretation of datasets. The core data available for interpretation is the Dustbox PM2.5 sensor data. The Airsift toolkit also brings in air quality data from select sites in the London Air Quality Network (LAQN) for comparison with the citizen data.
In order to blur the exact monitoring locations, the monitoring locations are shown with large blue circles to indicate the approximate monitoring location. Additional citizen monitoring locations are anonymous, and are not included on the Airsift map.
At the start of the monitoring period, the Dustboxes were co-located with the Marylebone Atmospheric Observatory, and a scaling factor was applied to calibrate the devices. Because the sensors were co-located and calibrated during a time of low to moderate pollution, the scaling factor could slightly amplify higher readings in relation to the LAQN readings. However, this would require further testing to demonstrate, since when comparing Dustbox levels with nearby LAQN levels (where available), readings are often comparable.
This data story is prepared under the assumption that all pollutant, cartographic and meteorological measurements are valid and not sufficiently biased to cause misrepresentation of results. Please refer to the Airsift Data Analysis Toolkits and Terms of Use for further information.
The research leading to these results has received funding from the European Research Council under the European Union’s Seventh Framework Programme (FP/2007-2013) / ERC Grant Agreement n. 313347, “Citizen Sensing and Environmental Practice: Assessing Participatory Engagements with Environments through Sensor Technologies.”
To cite this data story, please use the reference: Citizen Sense (2017) “Old Tidemill Garden,” Deptford Data Stories, 14 November. Available at: https://datastories-deptford.citizensense.net/old-tidemill.
This Old Tidemill data story is also available to download as a PDF.